Fractals scanner
- Indicators
- Jan Flodin
- Version: 1.3
- Updated: 15 September 2020
- Activations: 10
This multi time frame and multi symbol indicator identifies fractals patterns. As a bonus it can also scan for Parabolic SAR (pSAR) trend changes. Combined with your own rules and techniques, this indicator will allow you to create (or enhance) your own powerful system.
Features- Can monitor all symbols visible in your Market Watch window at the same time. Apply the indicator to just one chart and instantly monitor the entire market.
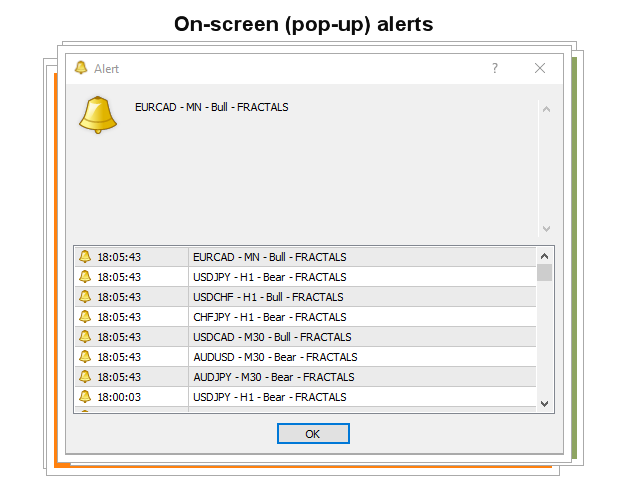
- Can monitor every time frame, from M1 to MN, and sends you a real-time alert when when the pattern or trend change has been identified. All Metatrader native alert types are supported.
- Can use RSI and/or moving average as trend filters to properly identify potential reversals.
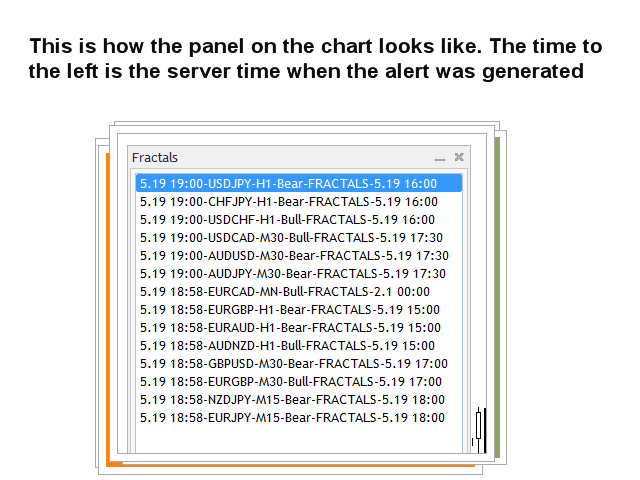
- The indicator includes an interactive panel. When clicking on an item a new chart will be opened with the symbol and time frame in question.
- The indicator writes the signals to a text file which can be used by an Expert Advisor (EA) for auto trading. You can find more information about the content and location of the text file in the blog.
Input parameters
The description and explanation of the input parameters can be found here.
Important
Please note that due to the multi functionality neither buy and sell advice nor lines and arrows will be drawn on the chart where the indicator is installed. An arrow showing the fractals pattern will be drawn on the chart which will be opened by clicking on a signal in the panel.
I recommend you to put the indicator on a clean (empty) chart without any other indicators or Expert Advisor on it which could interfere with the scanner.


Its so easy to waste money on Indicators that don't deliver but I am pleasantly surprised with this one. I rented it as a test and certainly feel its worth the money.