• Overview
  • Reviews
  • Comments (25)
  • What's new

Currency Strength Meter Pro Dashboard for MT5

Currency Strength Meter is the easiest way to identify strong and weak currencies. This indicator shows the relative strength of 8 major currencies + Gold: AUD, CAD, CHF, EUR, GBP, JPY, NZD, USD, XAU. Gold symbol can be changed to other symbols like XAG, XAU etc.


By default the strength value is normalised to the range from 0 to 100 for RSI algorithm:

  • The value above 60 means strong currency;
  • The value below 40 means weak currency;


This indicator needs the history data of all 28 major currency pairs and 9 timeframe. History data will be downloaded automatically as indicator will be started.


This Currency Strength Meter supports many powerful features:

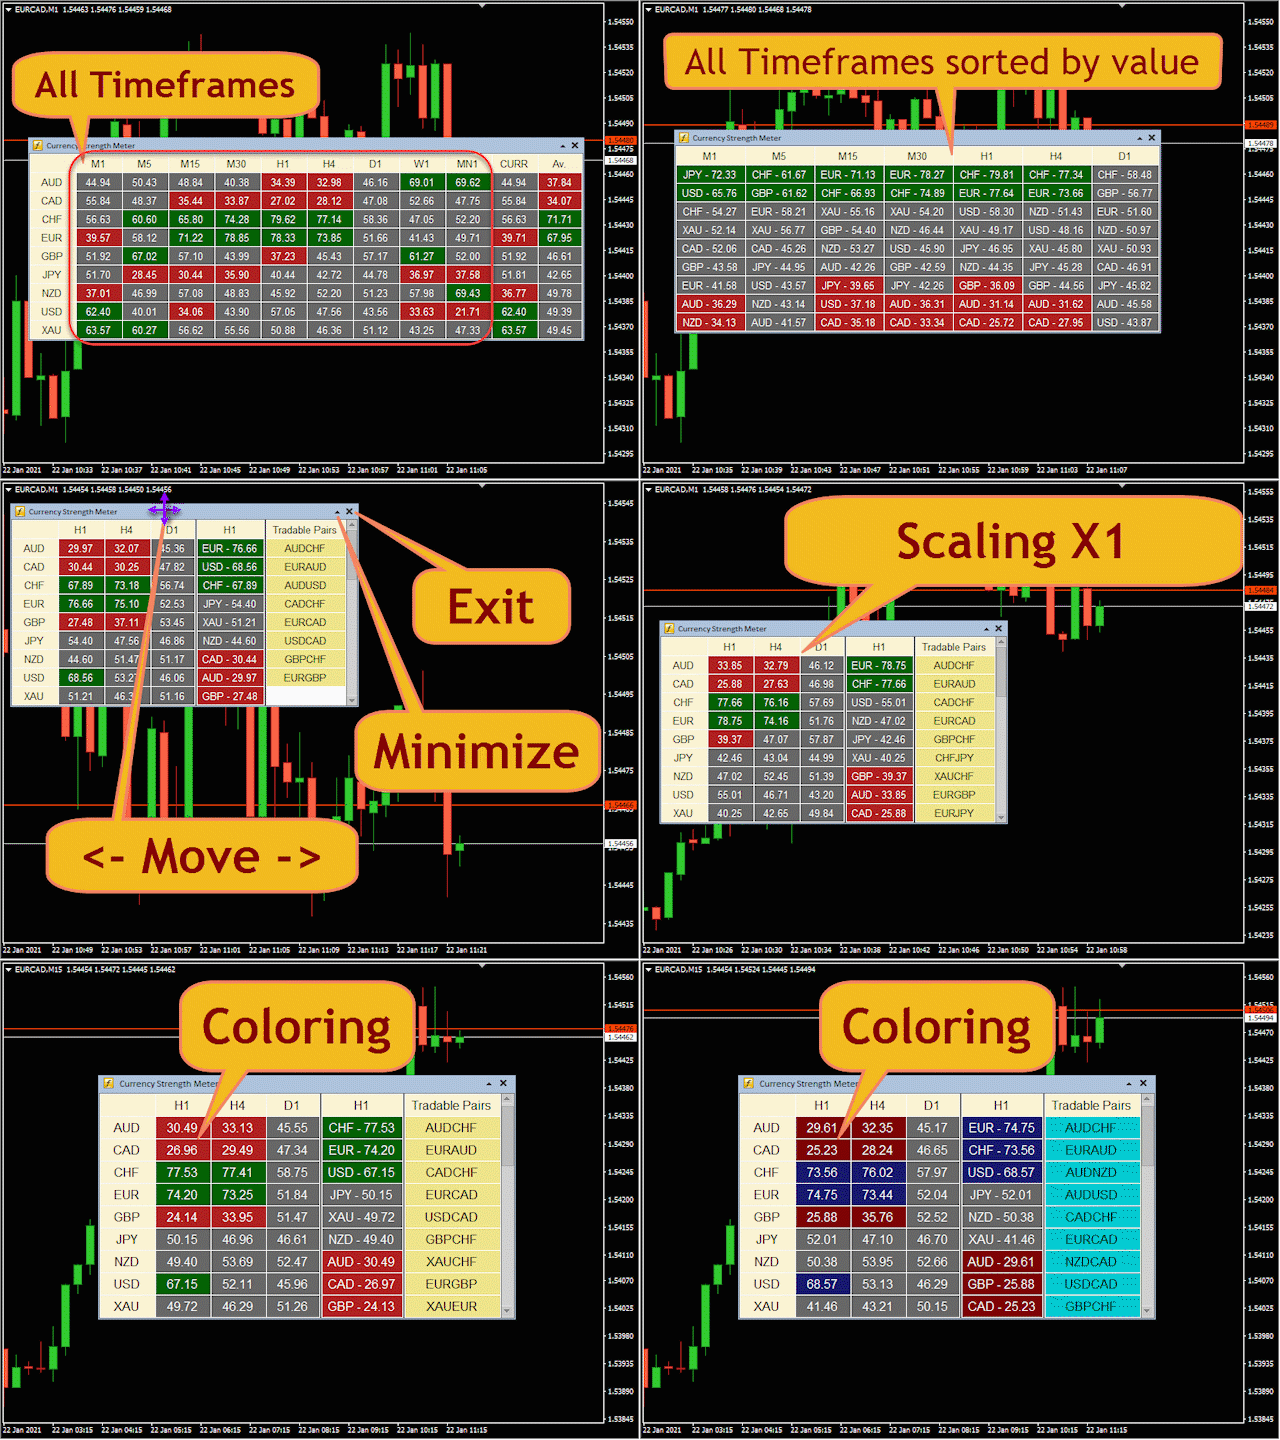
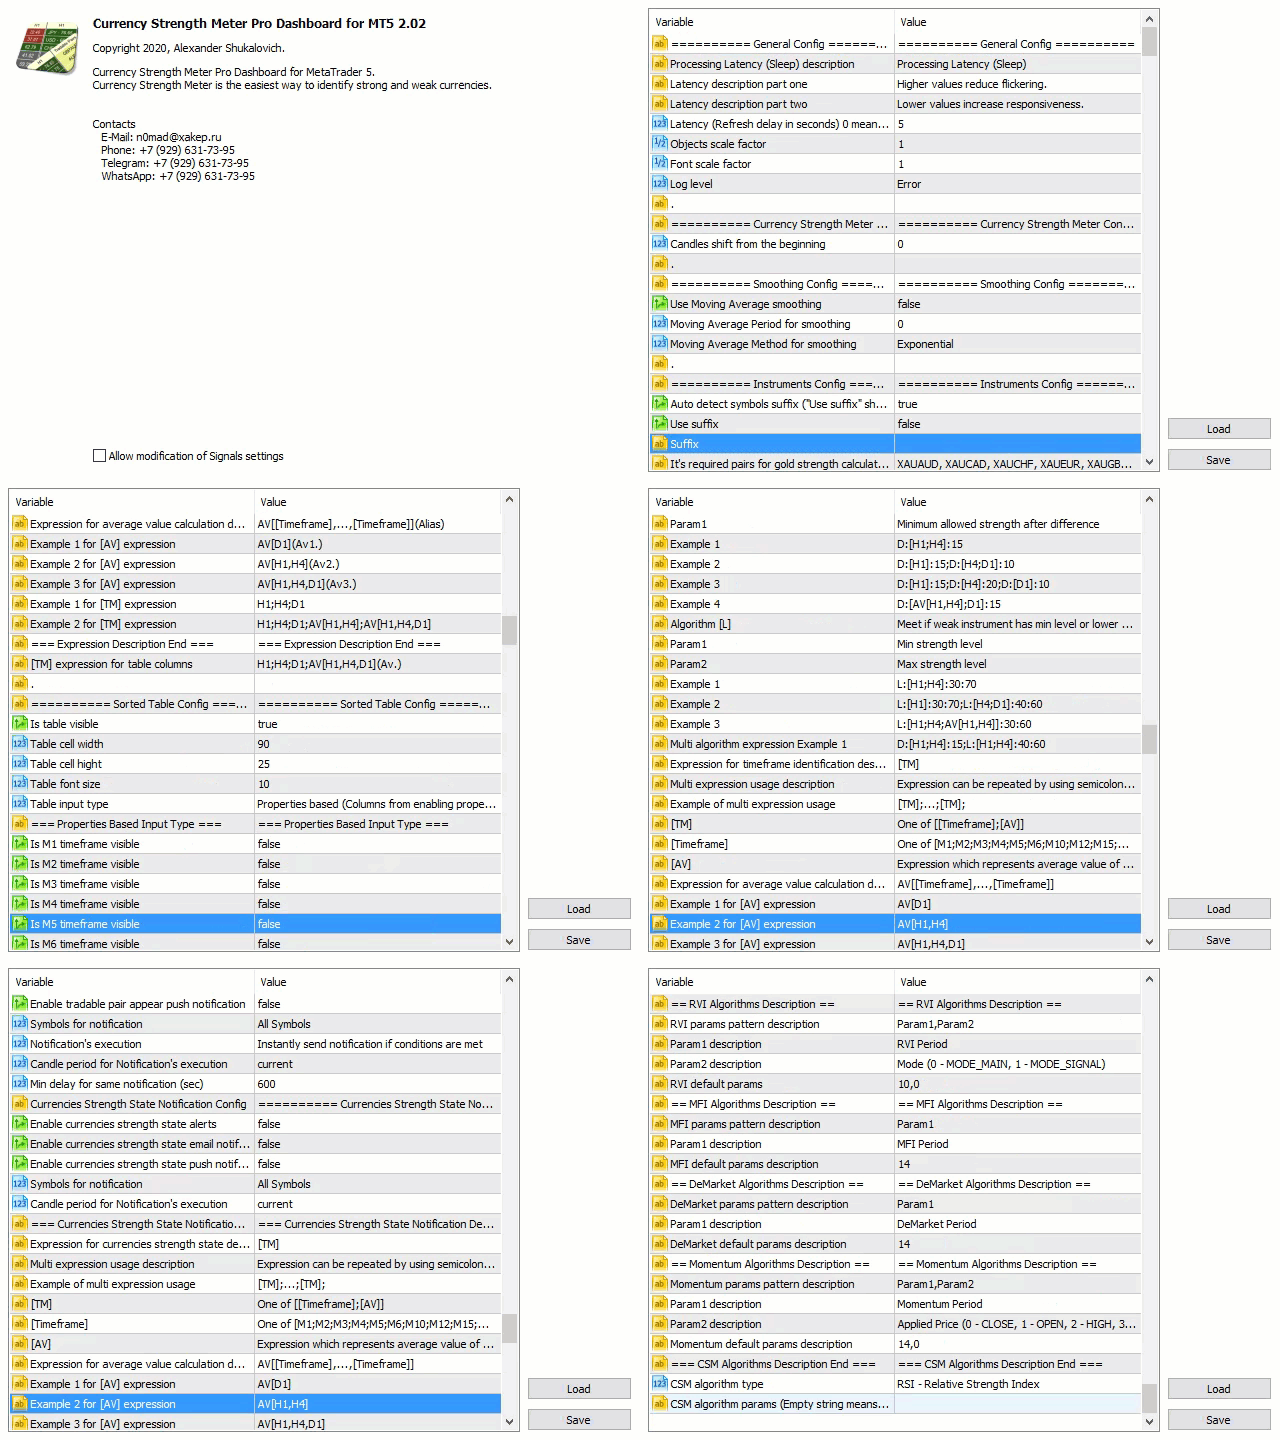
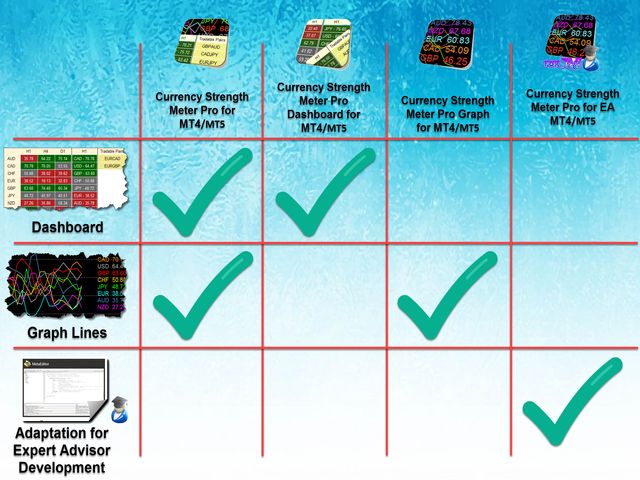
  • Currency Strength Meter Dashboard (shows strength of currencies for any timeframe with sorting by name or value at one user-friendly dashboard);
  • Allows to calculate average currency strength from specified timeframes;
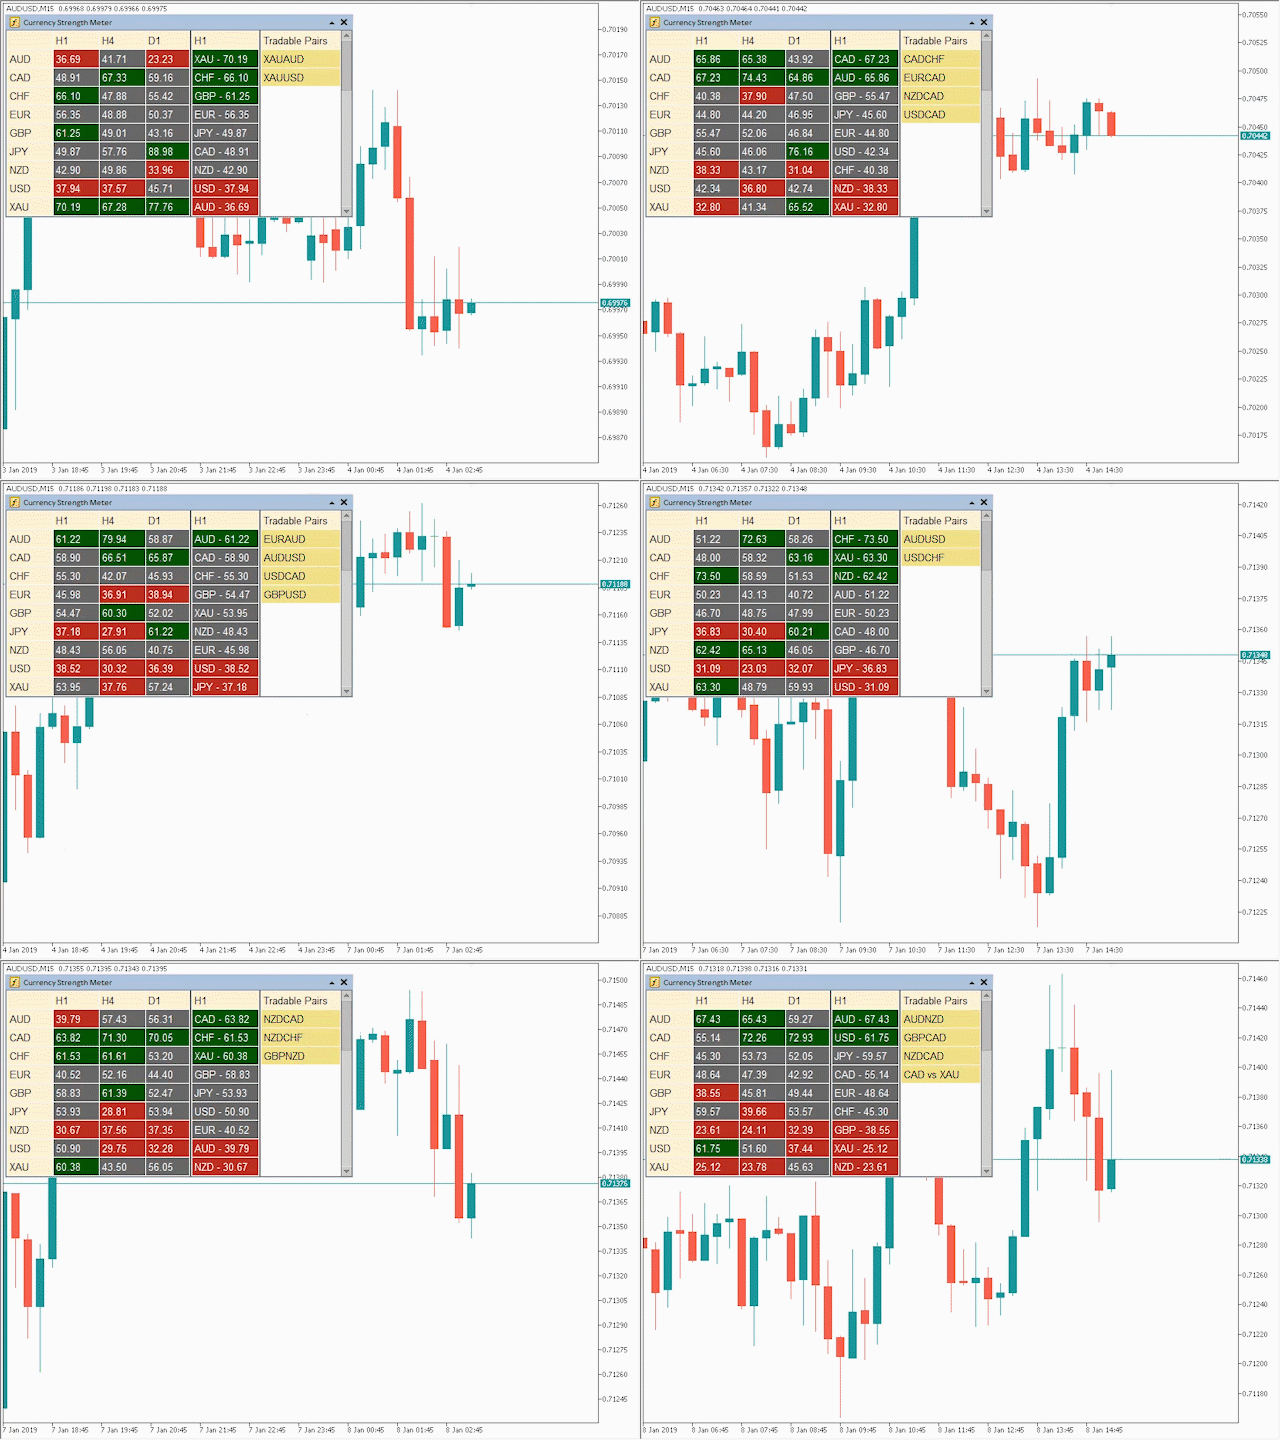
  • Searching tradable pairs by several algorithms (allows to find strong and weak currencies and show them at table as tradable pairs, you do not waste your time to do this calculation manually);
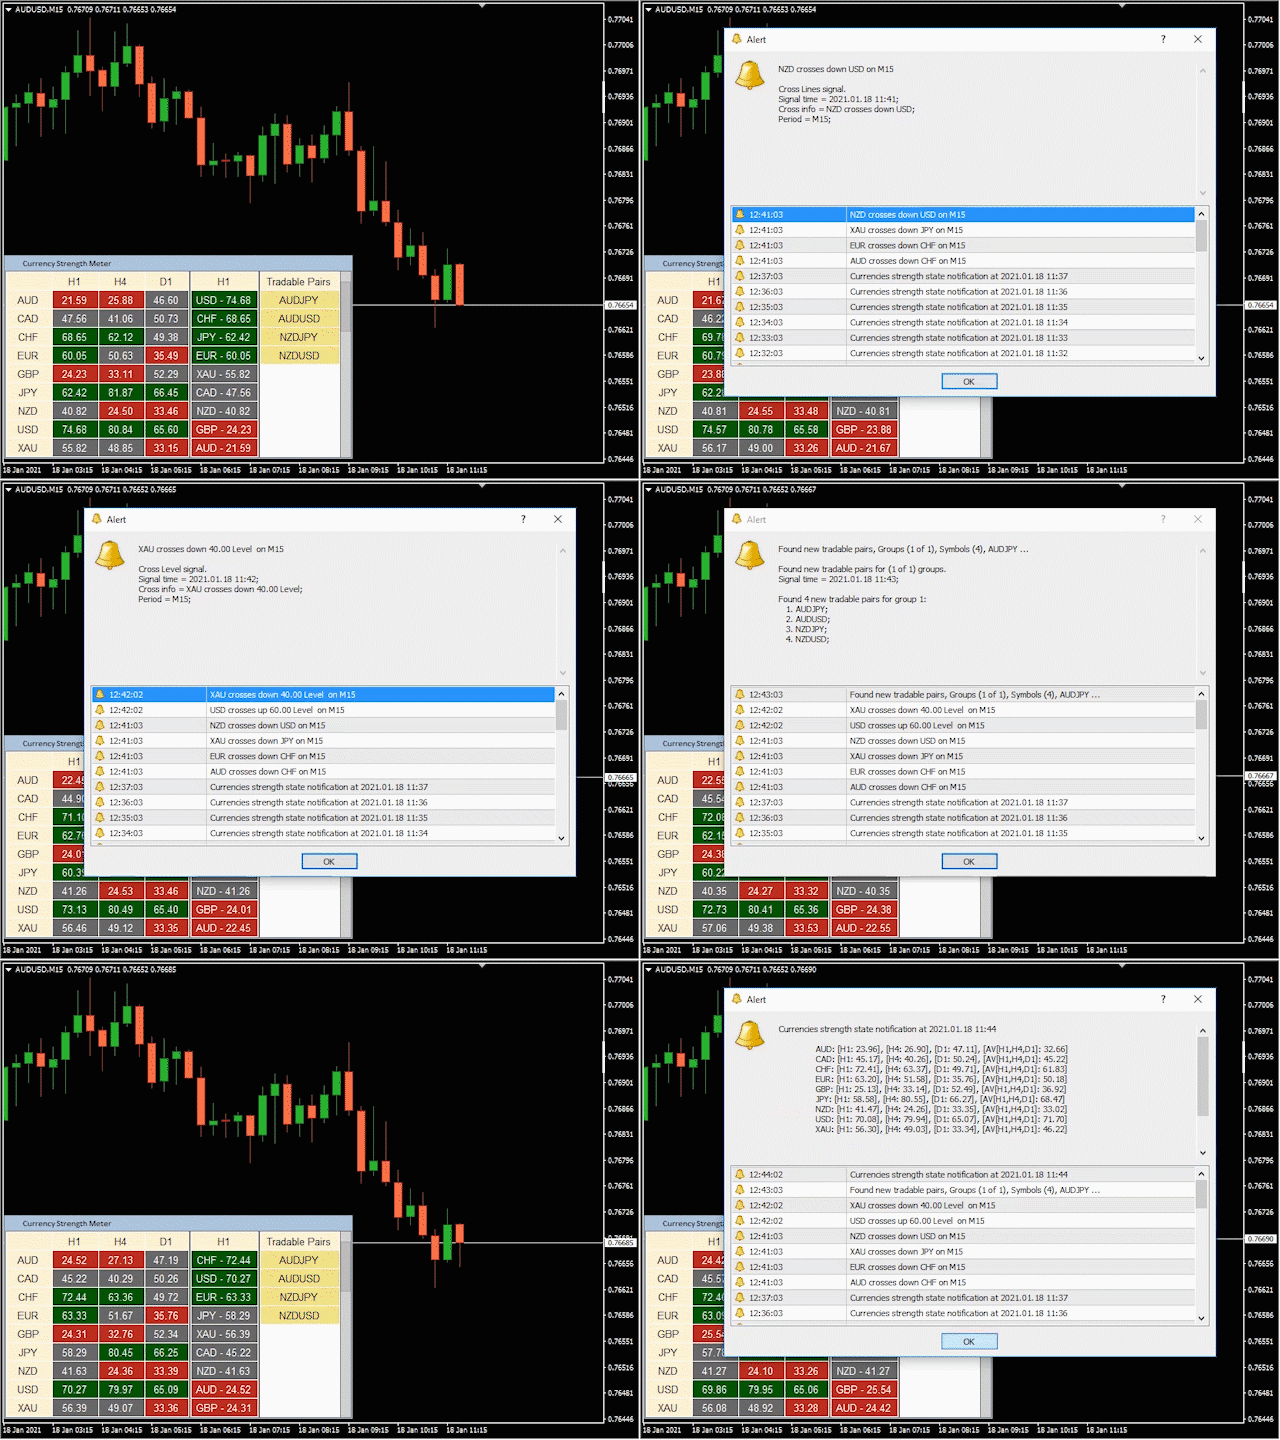
  • Powerful notification manager:
    • Notifications by crossing level (levels and timeframe is set by formula);
    • Notifications by crossing lines (timeframe is set by formula);
    • Notifications when new tradable pair is found (tradable pairs are found by formula);
    • Notifications about CSM state;
  • Many algorithms for calculation of strength of currencies (MACD, RSI, CCI, RVI, MFI, Stochastic, DeMarker, Momentum);
  • Powerful tradable pairs search engine by expression;
    • Min difference between strength of strong and weak currencies;
    • Min strength level for strong currency and weak currency;
    • Max difference between strength of strong and weak currencies;
    • Moving averages alignment;
  • Coloring of any object of Currency Strength Meter;
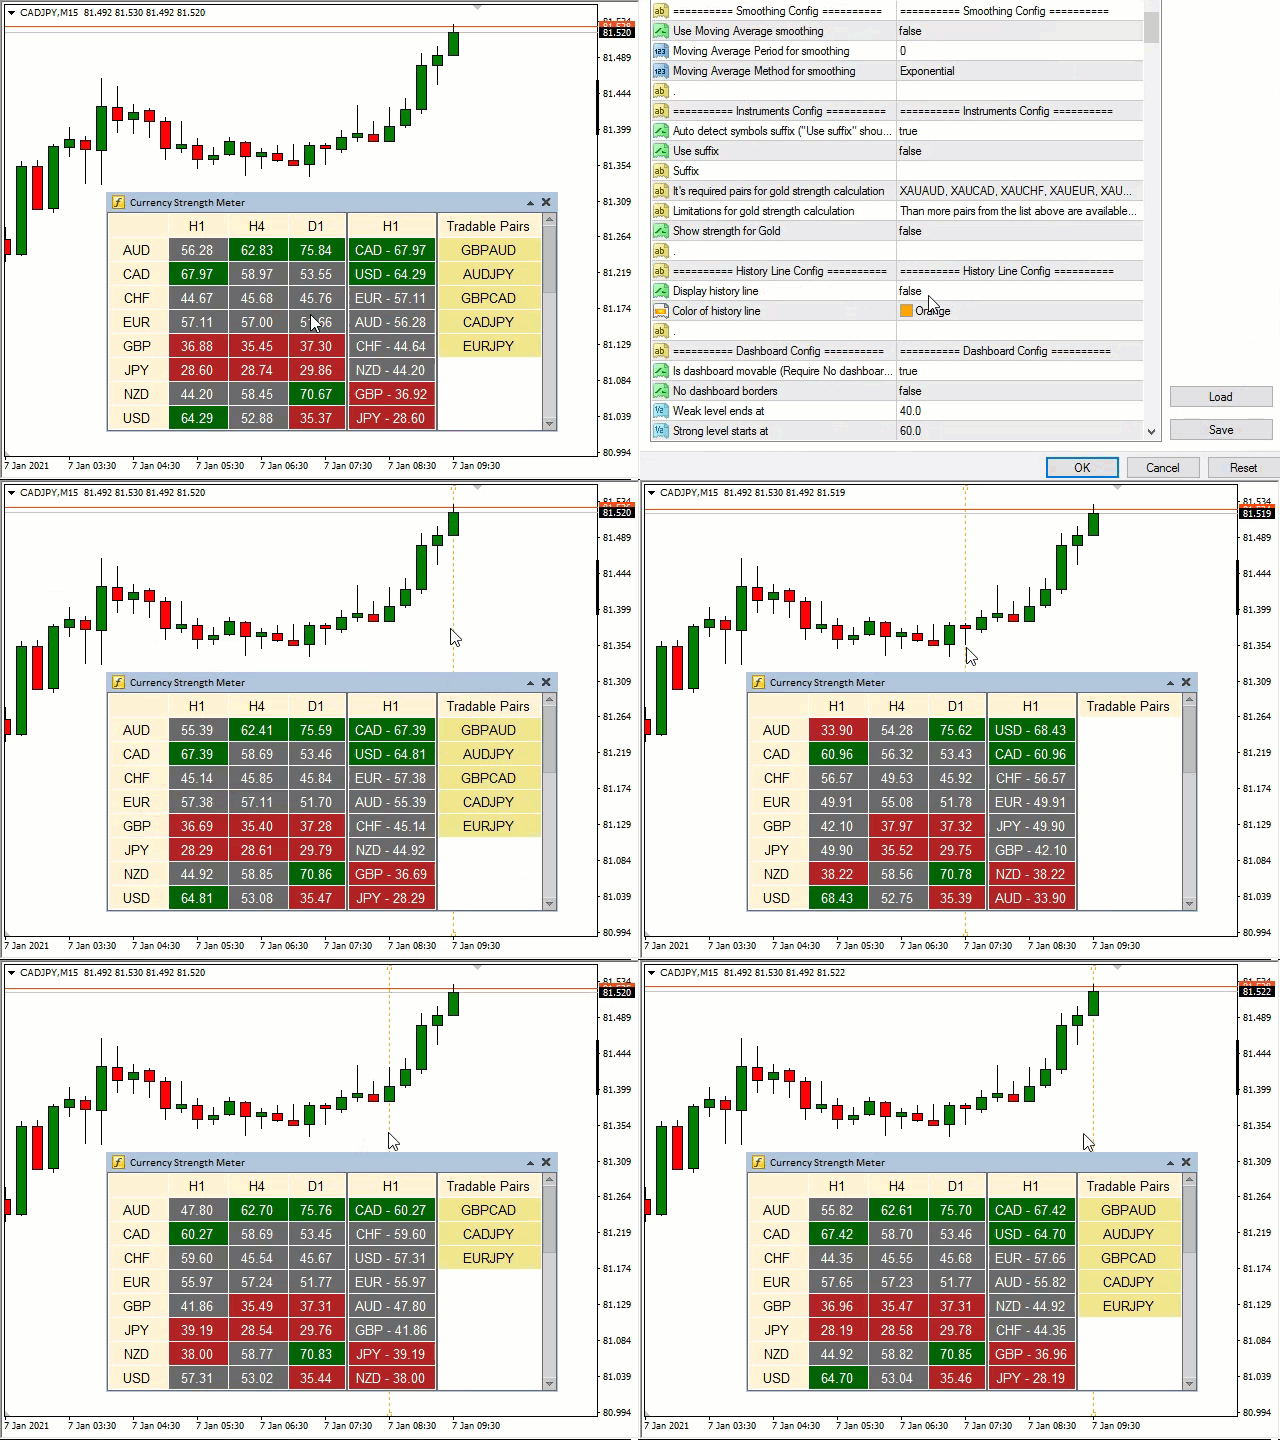
  • History line (allows to get Currency Strength Meter value for particular time in history, it helps to backtest your trading strategy with using Currency Strength Meter);
    • Calculation on candle close time;
    • Calculation on specified time with one minute precision;
  • Moving average smoothing (allowed to smooth result with specific algorithms);
  • Latency (allowed to calculate currency strength with specified interval, thus it takes less time for calculation);
  • User-friendly interface;
  • High resolution screens support (4K);


Relative links:


Communication:

  • Join Take Profit Channel to get latest news and updates.
  • Join Take Profit Group to discuss products of author.
  • If you want new feature contact me please.


Take profit!


Recommended products
LIMITED TIME SALE - 30% OFF! WAS $50 - NOW JUST $35! The RSI / TDI alert dashboard allows you to monitor RSIs at once (selectable by you) on every major pair you trade. You can use it in two ways: 1.   Select multiple time frames and the dash will show you when there are multiple time frames extended beyond normal trading conditions. A great indicator that price has pushed hard recently as it has achieved an overbought or oversold level across multiple time frames so a pullback or rever
Includes almost all the concepts related to Volume Profile: POC , Value Area , Developing POC , Anchored VWAP , Volume Delta ; since the “Total” in its name. It is fast in its calculations and simple to work with. Features: 1.    Selectable calculation timeframe to find most traded levels. 2.    Capable of calculating Volume Profile based on tick data 3.    Adjustable histogram bars by their count. 4.    Adjustable histogram bars by their height (price range). 5.    Showing Value Area (VA
VPO Profile MT5
Kyra Nickaline Watson-gordon
5 (2)
Definition : VPO is a Volume Price Opportunity. Instead of using bars or candles with an Open, High, Low, and Close price, each "bar" in a Market Profile is represented by horizontal bars against the price It is called Market Profile terminology. In other words volume-price-opportunity (VPO) profiles are histograms of how many volumes were traded at each price within the span of the profile. By using a VPO chart, you are able to analyze the amount of trading activity, based on volume, for each
Knowledge of the strength and weakness of each currency is vital for every forex trader. Our   Currency Strength Meter indicator   measures the strength of eight major currencies (USD, EUR, GBP, CHF, JPY, CAD, AUD, NZD) by using the Relative Strength Index indicator, also known as RSI. The Currency Strength Meter indicator shows you, simply and quickly, when a currency is oversold, overbought, or in "normal area". This way, you can identify which currency is the strongest and the weakest. Our
Breakeven Price MT5
Vladimir Chiosa
5 (1)
Nowadays a lot of traders need to open more positions for the same pair, because one position is not usually the best possible position. Thus a lot of trades are accumulated, sometimes with different lot sizes, and it is not easy to calculate the breakeven price of all opened positions. For solving this issue the Breakeven Price indicator was created. Breakeven Price is an MT5 indicator which calculates real time the breakeven price of all Buy & Sell positions opened by trader or EAs. It shows r
Advanced Trading Chaos  The main purpose of the indicator is to help the trader detect the signals described by Bill Williams in his books to make a quick and correct trading decision. 1)Bullish/Bearish Reversal Bar(BDB) 2) Divergent Bar(DB) 3) Second Sage Signal — the third consecutive Awesome Oscillator bar  4) Working fractals (Fractals that worked above/below the red forehead  5) Three bar coloring modes 5.1) Coloring of bars according to the AO indicator (Including the squatting bar) 5.2
Currency Strength Meter is the easiest way to identify strong and weak currencies. This indicator shows the relative strength of 8 major currencies + Gold: AUD, CAD, CHF, EUR, GBP, JPY, NZD, USD, XAU. Gold symbol can be changed to other symbols like XAG, XAU etc. By default the strength value is normalised to the range from 0 to 100 for RSI algorithm: The value above 60 means strong currency; The value below 40 means weak currency; This indicator needs the history data of all 28 major currency
Indicator MTF Qristalium Arrows is a semi - automatic trading system. It works on all currency pairs.  The indicator uses three rules: 1) we trade only on the trend, 2)"buy when everyone sells and sell when everyone buys", 3) the Price always goes against the crowd.  Indicator MTF Arrows Qristalium filter rules across multiple time frames using the built-in indicators. If the trend matches on the selected time intervals, the indicator will give an arrow to enter the market. Then you make you
PivotWave
Jeffrey Quiatchon
Introducing PivotWave – your ultimate trading companion that redefines precision and market analysis. Designed with traders in mind, PivotWave is more than just an indicator; it’s a powerful tool that captures the pulse of the market, identifying key turning points and trends with pinpoint accuracy. PivotWave leverages advanced algorithms to provide clear visual signals for optimal entry and exit points, making it easier for traders to navigate volatile market conditions. Whether you are a begin
Market screener: Price, Spread and Swap, for selected Symbols (Market Watch) You can customize the list: set only the Symbols (currency pairs) that are needed. The number of Symbols is unlimited. The list can be sorted in ascending or descending order (Symbol name). The panel can be moved to any place on the chart. You can also minimize the panel. There is an option to notify about the increased spread size compared to the average value. My  #1 Multifunctional utility : 66+ features, including
This indicator allows you to enjoy the two most popular products for analyzing request volumes and market deals at a favorable price: Actual Depth of Market Chart Actual Tick Footprint Volume Chart This product combines the power of both indicators and is provided as a single file. The functionality of Actual COMBO Depth of Market AND Tick Volume Chart is fully identical to the original indicators. You will enjoy the power of these two products combined into the single super-indicator! Below is
Looking to boost your trading performance on MT5? Introducing the signal indicator that will become your reliable ally on the path to success! This unique indicator utilizes arrows and a color-changing moving average to simplify your trading decisions. When the trend shifts upwards, the indicator turns the line blue, alerting you to potential price increases. If the trend reverses downwards, the line turns red, signaling a potential price drop. Additionally, arrows precisely indicate the optimal
Gold Step
Ignacio Agustin Mene Franco
Step Gold. It is an Echo oscillator for trading synthetic and forex indices at a professional level, grasping long trends, whether long or short works for all seasons also for scalping, very good level in the crash and boom pairs, volatility's , jump in forex pairs, eur/usd usd/jpy, gbp/eur, aud/cad and others! when it hits the ceiling it gives a signal to a short when it hits the floor it signals a long! Enjoy it.
The indicator automatically identifies and labels essential elements of market structure shift, including: Break of Structure (BoS): Detected when there is a significant price movement breaking previous structural points. It mark possible uptrend and downtrend lines(UP & DN, It means constantly update high and low ), and once the price breaks through these lines, mark the red (BEAR) and green (BULL) arrows. BoS typically occurs when the price decisively moves through swing lows or swing highs t
40% off. Original price: $50 ATR Scanner Pro is a multi symbol multi timeframe volatility scanner that monitors and analyzes Average True Range indicator value in up to 28 symbols and 9 timeframes in 3 modes : ATR value:   As a volatility dashboard it shows the ATR indicator value in all pairs and timeframes and signals when the ATR value reaches a maximum or minimum in a given duration. Short term ATR/Long term ATR ratio:  It shows ratio of 2 ATRs with different periods. It's useful in detect
Was: $249  Now: $149   Market Profile defines a number of day types that can help the trader to determine market behaviour. A key feature is the Value Area, representing the range of price action where 70% of trading took place. Understanding the Value Area can give traders valuable insight into market direction and establish the higher odds trade. It is an excellent addition to any system you may be using. Inspired by Jim Dalton’s book “Mind Over Markets”, this indicator is designed to suit the
VWAP Daily
Anton Polkovnikov
Weighted average price indicator or VWAP. The well-known standard VWAP with the beginning of the day is added with the function of selecting the periodization. It can be calculated both every day and on other periods. Also the indicator allows to exclude the volume from the calculation, which will allow using it on the cryptocurrencies and forex. There is an alert for a VWAP price crossing. There are 1 and 2 standard deviation. Settings: Volume: turning volume on and off in the calculation mecha
Before installing the HeatMap indicator make sure you are using a broker that gives you access to the Depth of market (DOM) !! This indicator creates a heatmap on your chart allowing you to see the buy or sell limit orders easily and in real time. You have the possibility to change the setting and the colors of the HeatMap in order to adapt to all markets and all charts. Here is an example of a setting you can use with the NASDAQ100 on the AMPGlobal broker :  https://www.youtube.com/watch?v=x0Y
Stratos Pali mt5
Michela Russo
4.43 (7)
Stratos Pali Indicator is a revolutionary tool designed to enhance your trading strategy by accurately identifying market trends. This sophisticated indicator uses a unique algorithm to generate a complete histogram, which records when the trend is Long or Short. When a trend reversal occurs, an arrow appears, indicating the new direction of the trend. Important Information Revealed Leave a review and contact me via mql5 message to receive My Top 5 set files for Stratos Pali at no cost ! Down
The uniqueness of this indicator lies in the volume accounting algorithm: accumulation occurs directly for the selected period without reference to the beginning of the day. The last bars can be excluded from the calculation, then the current data will have less influence on the significant levels (volumes) formed earlier. For a more accurate calculation, data from the M1 graph is used by default. The step of distribution of price volumes is regulated. By default, the right border of the display
This indicator is a scalping indicator intended solely for the Boom and Crash indices of the Deriv Limited market It supports Boom 500, Boom 1000, Crash 500 and Crash 1000 Not repaint and no bug The settings are intuitive and easy to use The product activation number is 20 The Time Frame used depends on the user If you are an aggressive scalper then just use M1 For long trades use M15 If you are conservative use M5 Please contact me for more details of its use
MultiFrame Trend Detector: Advanced Forex Trend Analysis Indicator The MultiFrame Trend Detector is a powerful MetaTrader 5 indicator that provides traders with comprehensive trend analysis across multiple timeframes. By dynamically adjusting trend thresholds based on the relationship between timeframes, the MultiFrame Trend Detector delivers reliable and consistent trend detection for all Forex pairs and precious metals. Key Features Custom Timeframe Analysis : Analyze trends across multiple, u
VR Grid Mt5
Vladimir Pastushak
3.43 (7)
The VR Grid indicator is designed to create a graphical grid with user-defined settings. Unlike the standard grid , VR Grid is used to build circular levels . Depending on the user's choice, the step between the round levels can be arbitrary. In addition, unlike other indicators and utilities, VR Grid maintains the position of the grid even when the time period changes or the terminal is rebooted. You can find settings, set files, demo versions, instructions, problem solving, at [blog] You can
FREE
Currency Strength Meter is the easiest way to identify strong and weak currencies. This indicator shows the relative strength of 8 major currencies + Gold: AUD, CAD, CHF, EUR, GBP, JPY, NZD, USD, XAU. Gold symbol can be changed to other symbols like XAG, XAU etc. By default the strength value is normalised to the range from 0 to 100 for RSI algorithm: The value above 60 means strong currency; The value below 40 means weak currency; This indicator needs the history data of all 28 major currency
Currency Power Meter shows the power of major currencies against each other. The indicator shows the relative strength of currency/pair at the current moment in a period of time (H4, daily, weekly, monthly). It is useful for day traders, swing traders and position traders with suitable period options. Currency power is the true reason of market trend: The strongest currency against the weakest currency will combine into a most trending pair. As we know, trend makes money and all traders love tre
Arrow Micro Scalper - an indicator designed for scalping and short-term trading, integrated into any chart and financial instrument (currency, crypto, stocks, metals). In its work, it uses wave analysis and a trend direction filter. It is recommended to use on time frames from M1 to H4. How to work with the indicator. The indicator contains 2 external parameters for changing the settings, the rest are already configured by default. Large arrows indicate a change in trend direction, blue - the
VolumeProfile MT5
Robert Hess
4.14 (7)
Description: The Volume Profile displays detailed informations of historical trading activities at certain price levels (Market Profile). Locate the areas with the best prices in the market and get an advantage over other market participants. Features: Customizable Market Profile Shows the "fair" Value Area with 70% of all Volume Shows critical low volume zones Shows VPOC, VAL and VAH Points integrated resource management to reduce the load while working with multiple charts Works on all timefr
Volume Profile V6
Andrey Kolesnik
4.5 (2)
The volume profile indicator of the market + a S mart oscillator . It works on almost all instruments - currency pairs , stocks , futures , cryptocurrency , on real volumes and on tick ones . You can set both the automatic definition of the profile range , for example , for a week or a month , etc . , and set the range manually by moving the boundaries ( two vertical lines red and blue ) . It is shown as a histogram . The width of the histogram at this level means , conditionally , the number of
A huge number of traders use the VolumeProfile/MarketProfile analysis method. And I think there is no need to explain such concepts as POC and VAH/VAL. However, the standard VolumeProfile representation has a drawback - we only see the current picture of the market. We see the "convexity" of the volume distribution within the period. But we don't see the main thing - the "migration" of the POC level during the price movement. Our indicator is unique. It is dynamic. The first feature is that the
This indicator is designed to determine the time of the greatest trading activity within a day. After this calculation, the indicator builds the most significant trading levels. Comparing these levels with actual price action can provide information about the strength and direction of market trends. Features of the indicator Timeframe must be below D1. Recommended timeframes: M15, M30 and H1. Timeframes above H1 can give a very rough picture. And the use of timeframes below M15 can lead to sho
Buyers of this product also purchase
Divergence Bomber
Ihor Otkydach
5 (3)
Each buyer of this indicator also receives the following for free: The custom utility "Bomber Utility", which automatically manages every trade, sets Stop Loss and Take Profit levels, and closes trades according to the rules of this strategy Set files for configuring the indicator for various assets Set files for configuring Bomber Utility in the following modes: "Minimum Risk", "Balanced Risk", and "Wait-and-See Strategy" A step-by-step video manual to help you quickly install, configure, and s
Golden Trend Indicator MT5
Noha Mohamed Fathy Younes Badr
4.89 (18)
Golden Trend indicator  is The best indicator for predicting trend movement this indicator never lags and never repaints and never back paints    and give  arrow buy and sell    before the candle appear  and it will help you and  will make your trading decisions clearer its work on all currencies and  gold and crypto and all time frame This unique  indicator uses very secret algorithms to catch the  trends, so you can trade using this indicator and see the trend clear on charts  manual guide and
Algo Pumping
Ihor Otkydach
5 (11)
PUMPING STATION – Your Personal All-inclusive strategy Introducing PUMPING STATION — a revolutionary Forex indicator that will transform your trading into an exciting and effective activity! This indicator is not just an assistant but a full-fledged trading system with powerful algorithms that will help you start trading more stable! When you purchase this product, you also get FOR FREE: Exclusive Set Files: For automatic setup and maximum performance. Step-by-step video manual: Learn how to tr
NOTE: CYCLEMAESTRO is distributed only on this website, there are no other distributors. Demo version is for reference only and is not supported. Full versione is perfectly functional and it is supported. CYCLEMAESTRO , the first and only indicator of Cyclic Analysis, useful for giving signals of TRADING, BUY, SELL, STOP LOSS, ADDING. Created on the logic of   Serghei Istrati   and programmed by   Stefano Frisetti ;   CYCLEMAESTRO   is not an indicator like the others, the challenge was to inter
MonetTrend — Премиум-индикатор для торговли по тренду (M30, H1, H4) MonetTrend — это мощный и визуально понятный трендовый индикатор, созданный для торговли на таймфреймах M30, H1 и H4. Он идеально подходит для работы с волатильными инструментами, такими как: • Золото (XAUUSD) • Криптовалюты (BTCUSD) • Валютные пары (EURUSD, USDJPY и др.) Ключевые особенности MonetTrend: • Автоматическое отображение Take Profit 1 (TP1) и Stop Loss (SL): После появления сигнала индикатор сразу показывает: • TP
Quantum TrendPulse
Bogdan Ion Puscasu
5 (13)
Introducing Quantum TrendPulse , the ultimate trading tool that combines the power of SuperTrend , RSI , and Stochastic into one comprehensive indicator to maximize your trading potential. Designed for traders who seek precision and efficiency, this indicator helps you identify market trends, momentum shifts, and optimal entry and exit points with confidence. Key Features: SuperTrend Integration: Easily follow the prevailing market trend and ride the wave of profitability. RSI Precision: Detect
TPSproTREND PrO MT5
Roman Podpora
4.72 (18)
Entry points at the bar close,  without redrawing .  Trend scanner  across all assets,  MTF - mode  and much more in one tool. We recommend using it together with   RFI LEVELS. ИНСТРУКЦИЯ RUS   /   INSTRUCTIONS  ENG         /         VERSION MT4   Main functions: Accurate entry signals WITHOUT REPAINTING! Once a signal appears, it remains valid! This is a significant distinction from repainting indicators that might provide a signal and then alter it, potentially leading to deposit losses. Now,
MetaForecast M5
Vahidreza Heidar Gholami
5 (3)
MetaForecast predicts and visualizes the future of any market using different powerful methods. While financial markets are not always predictable, if there are patterns in the past data, MetaForecast can learn and predict the future as accurately as possible. It features a complete implementation of neural networks embedded directly into the indicator, enabling traders to create and train AI models using data from multiple symbols to learn complex patterns. MetaForecast leverages your computer'
TPSpro RFI Levels MT5
Roman Podpora
4.55 (20)
Reversal zones / Peak volumes / Active zones of a major player =  TS TPSPROSYSTEM INSTRUCTIONS RUS  /  INSTRUCTIONS   ENG          /       Version MT4 Every buyer of this indicator additionally receives FREE: 3 months of access to trading signals from the RFI SIGNALS service - ready-made entry points according to the TPSproSYSTEM algorithm. Training materials with regular updates - immerse yourself in strategy and grow your professional level. 24/5 support on weekdays and access to a closed tra
MONEYTRON – ТВОЙ ЛИЧНЫЙ СИГНАЛ НА УСПЕХ! XAUUSD | AUDUSD | USDJPY | BTCUSD Поддержка таймфреймов: M5, M15, M30, H1 Почему трейдеры выбирают Moneytron? 82% успешных сделок — это не просто цифры, это результат продуманной логики, точного алгоритма и настоящей силы анализа. Автоматические сигналы на вход — не нужно гадать: когда покупать, когда продавать. 3 уровня Take Profit — ты сам выбираешь свой уровень прибыли: безопасный, уверенный или максимум. Четкий Stop Loss — контролируешь риск
Best Solution for any Newbie or Expert Trader! This Indicator is a unique, high quality and affordable trading tool because we have incorporated a number of proprietary features and a new formula. With only ONE chart you can read Currency Strength for 28 Forex pairs! Imagine how your trading will improve because you are able to pinpoint the exact trigger point of a new trend or scalping opportunity? User manual:   click here That's the first one, the original! Don't buy a worthless wannabe clone
FX Volume MT5
Daniel Stein
4.82 (17)
FX Volume: Experience Genuine Market Sentiment from a Broker’s Perspective Quick Overview Looking to elevate your trading approach? FX Volume provides real-time insights into how retail traders and brokers are positioned—long before delayed reports like the COT. Whether you’re aiming for consistent gains or simply want a deeper edge in the markets, FX Volume helps you spot major imbalances, confirm breakouts, and refine your risk management. Get started now and see how genuine volume data can
RelicusRoad Pro MT5
Relicus LLC
4.79 (19)
How many times have you bought a trading indicator with great back-tests, live account performance proof with fantastic numbers and stats all over the place but after using it, you end up blowing your account? You shouldn't trust a signal by itself, you need to know why it appeared in the first place, and that's what RelicusRoad Pro does best! User Manual + Strategies + Training Videos + Private Group with VIP Access + Mobile Version Available A New Way To Look At The Market RelicusRoad is th
CBT Quantum Maverick High-Efficiency Binary Trading System CBT Quantum Maverick is a finely tuned, high-performance Binary Options Trading System designed for traders seeking precision, simplicity, non-repaint signals and disciplined trading. No customization is required—this system is optimized for effective results right out of the box. Simply follow the signals, which can be mastered with a bit of practice. Key Features: Signal Precision: New-bar-based trading signals—targeting the next ca
Matrix Arrow Indicator MT5
Juvenille Emperor Limited
5 (13)
Matrix Arrow Indicator MT5  is a unique 10 in 1 trend following   100% non-repainting  multi-timeframe indicator that can be used on all symbols/instruments:   forex,   commodities,   cryptocurrencies,   indices,   stocks .  Matrix Arrow Indicator MT5  will determine the current trend at its early stages, gathering information and data from up to 10 standard indicators, which are: Average Directional Movement Index (ADX) Commodity Channel Index (CCI) Classic Heiken Ashi candles Moving Average
This dashboard shows the latest available   harmonic patterns   for the selected symbols, so you will save time and be more efficient /   MT4 version . Free Indicator:   Basic Harmonic Pattern Comparison of "Basic Harmonic Pattern" vs. "Basic Harmonic Patterns Dashboard" Indicators Feature Basic Harmonic Pattern Basic Harmonic Patterns Dashboard Functionality Detects and displays harmonic patterns on a single chart Searches multiple symbols and timeframes for harmonic patterns, displays res
Gold Trend 5
Sergei Linskii
3.5 (2)
Gold Trend - this is a good stock technical indicator. The indicator algorithm analyzes the price movement of an asset and reflects volatility and potential entry zones. The best indicator signals: For SELL = red histogram + red SHORT pointer + yellow signal arrow in the same direction. For BUY = blue histogram + blue LONG pointer + aqua signal arrow in the same direction. Benefits of the indicator: The indicator produces signals with high accuracy. A confirmed arrow signal can only be redrawn
Grabber System MT5
Ihor Otkydach
5 (6)
Let me introduce you to an excellent technical indicator – Grabber, which works as a ready-to-use "All-Inclusive" trading strategy. Within a single code, it integrates powerful tools for technical market analysis, trading signals (arrows), alert functions, and push notifications. Every buyer of this indicator also receives the following for free: Grabber Utility for automatic management of open orders Step-by-step video guide: how to install, configure, and trade with the indicator Custom set fi
MetaBands M5
Vahidreza Heidar Gholami
4.5 (2)
MetaBands uses powerful and unique algorithms to draw channels and detect trends so that it can provide traders with potential points for entering and exiting trades. It’s a channel indicator plus a powerful trend indicator. It includes different types of channels which can be merged to create new channels simply by using the input parameters. MetaBands uses all types of alerts to notify users about market events. Features Supports most of the channel algorithms Powerful trend detection algorith
Introducing   Quantum Breakout PRO , the groundbreaking MQL5 Indicator that's transforming the way you trade Breakout Zones! Developed by a team of experienced traders with trading experience of over 13 years,   Quantum Breakout PRO   is designed to propel your trading journey to new heights with its innovative and dynamic breakout zone strategy. Quantum Breakout Indicator will give you signal arrows on breakout zones with 5 profit target zones and stop loss suggestion based on the breakout b
Limited Special now on!  GET 20% OFF! Was $249, now only $199!  The Beast Super Signal indicator is a straightforward, trend-based indicator that's easy to use. It continuously monitors current market conditions, looking for new trends or opportunities to join existing ones. When all of its internal strategies align perfectly, the indicator provides a buy or sell signal. Just act on the signal arrow alert; no additional confirmation is needed. After purchase message me to be added to my priva
Trend Forecaster
Alexey Minkov
5 (6)
The Trend Forecaster indicator utilizes a unique proprietary algorithm to determine entry points for a breakout trading strategy. The indicator identifies price clusters, analyzes price movement near levels, and provides a signal when the price breaks through a level. The Trend Forecaster indicator is suitable for all financial assets, including currencies (Forex), metals, stocks, indices, and cryptocurrencies. You can also adjust the indicator to work on any time frames, although it is recommen
IQ Gold Gann Levels a non-repainting, precision tool designed exclusively for XAUUSD/Gold intraday trading. It uses W.D. Gann’s square root method to plot real-time support and resistance levels, helping traders spot high-probability entries with confidence and clarity. William Delbert Gann (W.D. Gann) was an exceptional market analyst, whose trading technique was based on a complex blend of mathematics, geometry, astrology, and ancient mathematics which proved to be extremely accurate. Download
First of all, it's worth emphasizing that this Trading Indicator is Non-Repainting, Non-Redrawing, and Non-Lagging, which makes it ideal for both manual and algorithmic trading. User manual, presets, and online support included. The AI Trend Pro Max is a sophisticated, all-in-one trading system designed for traders who seek precision , power , and simplicity . Built upon years of development through previous indicators, and this is the most advanced version yet — equipped with multiple signal la
MTF Supply Demand Zones MT5
Georgios Kalomoiropoulos
5 (1)
Next Generation Of Automated Supply And Demand Zones. New and Innovative Algorithm that Works At Any Chart. All Zones Are Being Created Dynamically According To Price Action Of The Market. AMAZING OFFER --> Activations from 5 to 20 for "MTF Supply Demand Zones" and "Automated Trendlines" TWO TYPES OF ALERTS -->  1) WHEN PRICE HITS A ZONE    2)WHEN A NEW ZONE IS FORMED  If you get the MTF Supply Demand Zones you can join the " Trade Like Me " Video Series. It contains 14 Live Sessions where 
Top indicator for MT5   providing accurate signals to enter a trade without repainting! It can be applied to any financial assets:   forex, cryptocurrencies, metals, stocks, indices .  Watch  the video  (6:22) with an example of processing only one signal that paid off the indicator! MT4 version is here It will provide pretty accurate trading signals and tell you when it's best to open a trade and close it. Most traders improve their trading results during the first trading week with the help of
Easy Breakout MT5
Mohamed Hassan
4.6 (5)
After your purchase, feel free to contact me for more details on how to receive a bonus indicator called VFI, which pairs perfectly with Easy Breakout for enhanced confluence!     Easy Breakout MT5   is a powerful price action trading system built on one of the most popular and widely trusted strategies among traders: the   Breakout strategy ! This indicator delivers crystal-clear Buy and Sell signals based on breakouts from key support and resistance zones. Unlike typical breakout indicators
Gold TMAF MTF  - this is a good stock technical indicator. The indicator algorithm analyzes the price movement of an asset and reflects volatility and potential entry zones. The best indicator signals: For SELL = red upper boundary of TMA2 above the red upper boundary of TMA1 + red fractal indicator above + yellow SR signal arrow in the same direction. For BUY = blue lower boundary of TMA2 below the blue lower boundary of TMA1 + blue fractal indicator from below + aqua SR signal arrow in the sam
Best Solution for any Newbie or Expert Trader! This indicator is a unique, high quality and affordable trading tool because we have incorporated a number of proprietary features and a secret formula. With only ONE chart it gives Alerts for all 28 currency pairs. Imagine how your trading will improve because you are able to pinpoint the exact trigger point of a new trend or scalping opportunity! Built on new underlying algorithms it makes it even easier to identify and confirm potential trades.
FxaccurateLS
Shiv Raj Kumawat
WHY IS OUR FXACCCURATE LS MT5 THE PROFITABLE ? PROTECT YOUR CAPITAL WITH RISK MANAGEMENT Gives entry, stop and target levels from time to time. It finds Trading opportunities by analyzing what the price is doing during established trends. POWERFUL INDICATOR FOR A RELIABLE STRATEGIES We have made these indicators with a lot of years of hard work. It is made at a very advanced level. Established trends provide dozens of trading opportunities, but most trend indicators completely ignore them! The
More from author
Currency Strength Meter is the easiest way to identify strong and weak currencies. The indicator shows the relative strength of 8 major currencies: AUD, CAD, CHF, EUR, GBP, JPY, NZD, USD. By default the strength value is normalised to the range from 0 to 100 for RSI algorithm: The value above 60 means strong currency; The value below 40 means weak currency; The indicator is created and optimized for using it externally at an Expert Advisors or as a Custom Indicator inside your programs. For di
Currency Strength Meter is the easiest way to identify strong and weak currencies. This indicator shows the relative strength of 8 major currencies + Gold: AUD, CAD, CHF, EUR, GBP, JPY, NZD, USD, XAU. Gold symbol can be changed to other symbols like XAG, XAU etc. By default the strength value is normalised to the range from 0 to 100 for RSI algorithm: The value above 60 means strong currency; The value below 40 means weak currency; This indicator needs the data of all 28 major currency pairs a
Trend Power for MT4
ALEKSANDR SHUKALOVICH
4.75 (4)
Trend Power Indicator is an indicator which helps to identify trend direction and its power by using moving averages ZigZag pattern and correlations of tradable instruments. It provides trend power data with user-friendly interface which can be read easily and fast.   This indicator by default is configured for trading of Adam Khoo's ( Piranhaprofit ) strategies. It saves mass of time for searching of tradable pairs by his strategies. It indicates when all required moving averages are alignment
Currency Strength Meter is the easiest way to identify strong and weak currencies. This indicator shows the relative strength of 8 major currencies + Gold: AUD, CAD, CHF, EUR, GBP, JPY, NZD, USD, XAU. Gold symbol can be changed to other symbols like XAG, XAU etc. By default the strength value is normalised to the range from 0 to 100 for RSI algorithm: The value above 60 means strong currency; The value below 40 means weak currency; This indicator needs the history data of all 28 major currency
Chart State Saver for MT5 is utility which helps to save states of all your charts even if they will be closed. And then all saved charts' states can be easily loaded back to charts. It stores templates for each particular currency pair and automatically applies them to charts once they will be opened at next time. Also they can be applied to the charts by your own needs. Thus you can close any chart at your MT5 without scaring to lose chart's data like drawls, messages, chart styling and so o
Currency Strength Meter Pro for MT4
ALEKSANDR SHUKALOVICH
4.22 (9)
Currency Strength Meter is the easiest way to identify strong and weak currencies. This indicator shows the relative strength of 8 major currencies + Gold: AUD, CAD, CHF, EUR, GBP, JPY, NZD, USD, XAU. Gold symbol can be changed to other symbols like XAG, XAU etc. By default the strength value is normalised to the range from 0 to 100 for RSI algorithm: The value above 60 means strong currency; The value below 40 means weak currency; This indicator needs the data of all 28 major currency pairs
Currency Strength Meter is the easiest way to identify strong and weak currencies. This indicator shows the relative strength of 8 major currencies + Gold: AUD, CAD, CHF, EUR, GBP, JPY, NZD, USD, XAU. Gold symbol can be changed to other symbols like XAG, XAU etc. By default the strength value is normalised to the range from 0 to 100 for RSI algorithm: The value above 60 means strong currency; The value below 40 means weak currency; This indicator needs the data of all 28 major currency pairs
News Scalping Executor is an advisor which helps to trade news with high impact and huge volatility. This advisor helps to create two opposite orders with risk management. It moves automatically stop loss level to avoid losses as much as possible by using many different algorithms. It helps to avoid trading the news if spread suddenly becomes very huge. To be profitable with this type of trading you should choose the most volatile types of news such as: GDP, CPI, Unemployment Claims, Interest
News Scalping Executor Pro is an advisor which helps to trade news with high impact and huge volatility. This advisor helps to create two opposite orders with risk management and profit protection. It moves automatically stop loss level to avoid losses as much as possible by using many different algorithms. It helps to avoid trading the news if spread suddenly becomes very huge. It can lock profit by moving stop loss or partially closing of orders. To be profitable with this type of trading y
Chart State Saver for MT4 is utility which helps to save states of all your charts even if they will be closed. And then all saved charts' states can be easily loaded back to charts. It stores templates for each particular currency pair and automatically applies them to charts once they will be opened at next time. Also they can be applied to the charts by your own needs. Thus you can close any chart at your MT4 without scaring to lose chart's data like drawls, messages, chart styling and so o
The MA Bounce Strategy is a strategy that seeks to long FX pairs on a strong uptrend as they bounce off their MA support and shorting FX pairs on a strong downtrend as they bounce off MA resistance. The best suitable periods of moving averages for that strategy are 18, 30, 50. This indicator helps to identify and find place for potential market entry by MA bounce strategy. Read   More information about  MA Bounce Strategy . By default MA Bounce Strategy indicator is configured for trading of M1
News Scalping Executor is an utility which helps to trade high impact and huge volatility   news . This utility helps to create two opposite orders with risk management and profit protection. It moves automatically stop loss level to avoid losses as much as possible by using many different algorithms. It helps to avoid trading the news if spread suddenly becomes very huge. It can lock profit by moving stop loss or partially closing of orders. To be profitable with this type of trading you shou
News Scalping Executor Pro is an utility which helps to trade high impact and huge volatility news . This utility helps to create two opposite orders with risk management and profit protection. It moves automatically stop loss level to avoid losses as much as possible by using many different algorithms. It helps to avoid trading the news if spread suddenly becomes very huge. It can lock profit by moving stop loss or partially closing of orders. To be profitable with this type of trading you sh
Currency Strength Meter is the easiest way to identify strong and weak currencies. This indicator shows the relative strength of 8 major currencies + Gold: AUD, CAD, CHF, EUR, GBP, JPY, NZD, USD, XAU. Gold symbol can be changed to other symbols like XAG, XAU etc. By default the strength value is normalised to the range from 0 to 100 for RSI algorithm: The value above 60 means strong currency; The value below 40 means weak currency; This indicator needs the history data of all 28 major currency
Currency Strength Meter is the easiest way to identify strong and weak currencies.   The   indicator shows the relative strength of 8 major currencies: AUD, CAD, CHF, EUR, GBP, JPY, NZD, USD. By default the strength value is normalised to the range from 0 to 100 for RSI algorithm: The value above 60 means strong currency; The value below 40 means weak currency; The indicator is created and optimized for using it externally at an Expert Advisors or as a Custom Indicator inside your programs. F
Trend Power for MT5
ALEKSANDR SHUKALOVICH
5 (1)
Trend Power Indicator is an indicator which helps to identify trend direction and its power by using moving averages ZigZag pattern and correlations of tradable instruments. It provides trend power data with user-friendly interface which can be read easily and fast.   This indicator by default is configured for trading of   Adam Khoo's   ( Piranhaprofit ) strategies. It saves mass of time for searching of tradable pairs by his strategies. It indicates when all required moving averages are align
The MA Bounce Strategy is a strategy that seeks to long FX pairs on a strong uptrend as they bounce off their MA support and shorting FX pairs on a strong downtrend as they bounce off MA resistance. The best suitable periods of moving averages for that strategy are 18, 30, 50. This indicator helps to identify and find place for potential market entry by MA bounce strategy.  More information about  MA Bounce Strategy can be read by this link  https://www.mql5.com/en/blogs/post/743037 .  By defau
Filter:
No reviews
Reply to review
Version 7.10 2024.11.29
Added MetaTrader global variables for tradable pairs.
Improved names of some input properties.
Fixed dashboard minimize state while switching charts symbols or timeframes.
Fixed releasing resources after using them.
Refactoring and minor code improvements.
Recompiled with new version of MetaTrader environment.
Version 7.0 2023.12.18
Improved CCI algorithm and its coordinate system is converted to dimension from 0 to 100 values.
Improved RVI algorithm and its coordinate system is converted to dimension from 0 to 100 values.
Improved Momentum algorithm and its coordinate system is converted to dimension from 0 to 100 values.
Improved DeMarker algorithm.
Improved MACD algorithm.
Added ADX algorithm for instruments' volatility measurement (not to measure strength, the higher the value, the higher the volatility of the instrument).
Changed default table's cell width for simple table from 60 to 62 to accommodate time at info cell.
Log level changed from "Disabled" to "Error" (if you do not need logs messages you have to change property "Log level" to "Disabled").
"Update on every tick " now updates CSM data if new quote would be received for any of monitoring pairs.
Fixed blinking of tables on dashboard.
Fixed clicking on grid of table's headers cells.
Added information cell on table's header which can show different types of information or be as a "Button" to do some work.
Updated contact information at indicator's "About" property tab.
Added possibility to get alerts separately for all found tradable pairs.
Added seconds to notification's time in notifications signals.
Improved logging.
Added possibility to move dashboard to main window and any sub-window of a chart.
Fixed incorrect focus of dashboard's controls if there are several sub windows on a chart.
Added possibility to use "." and ";" symbols as a separator for timeframes formula for average value calculation of simple and sorted dashboard tables.
Recompiled with new MQL compiler and others minor improvements and fixes.
Version 6.10 2023.02.28
Added possibility to change number of decimals for simple table, sorted table, graph labels and graph lines libels.
Version 6.0 2023.02.17
Added sessions time for throwing notifications.
Added possibility to choose show or not show cross lines notification for instruments' for which symbol does not exist.
Improved support of partial strength calculation if not all required history data is available.
Improved indicator work stability.
Improved trace messages.
Fixed mistype at trace messages.
Fixed algorithm of moving average value calculation.
Fixed tradable pairs searching with moving average algorithm in some cases.
Fixed not throwing of cross lines notification if at least one of 28 symbols does not exists.
Fixed out of range error in some cases.
Version 5.41 2022.10.18
Fixed indicator loading if some history data is missed for MACD algorithm.
Version 5.40 2022.10.17
Added MACD algorithm for currencies' strength value calculation.
Added LM (max level boundary) algorithm for tradable pairs searching.
Version 5.30 2022.09.29
Added better support of x0.5 scaling.
Window's title icon, Window's caption text and Window's main buttons icons are aligned by center.
Version 5.22 2022.09.11
Added possibility to show label for history line with history line's date and time.
Version 5.12 2022.08.30
Workaround incorrect GBP symbols parsing by IG broker.
Version 5.11 2022.08.23
Workaround incorrect symbol parsing by IG broker.
Version 5.10 2022.07.25
Improved strength value calculation if new candle for some pairs of 28 is appeared and for some pairs of 28 new candle is not appeared yet (haven't received new ticks for some pairs of 28 at time when new candle should be formed).
Version 5.0 2022.06.19
Added possibility to change table header text color for all tables.
Added possibility to change text color of table cells for weak, strong and neutral currencies strengths.
Added "Disabled" log level and it's used by default.
Added possibility to change symbol of current chart by clicking instruments names on headers of simple table rows on dashboard.
Added possibility to change timeframe of current chart by clicking on timeframes on header of simple table columns on dashboard.
Added possibility to change timeframe of current chart by clicking on timeframes on header of sorted table columns on dashboard.
Updated GUI Processor with many graphical improvements and bug fixes of UI processor.
Improved strength calculation speed.
Improved calculation speed of indicator processors for "Time based process" (if possible it passes calculation to "Index base process" which is much faster than "Time based process").
Improved initialization speed of CorrelatedIndicatorProcessor for MT5.
Improved log messages and added new messages to log.
Workaround incorrect symbol parsing by XM broker.
Fixed not updating indicator strength values in some cases (when history time equals to 0, transmitting to "Index base" calculation).
Fixed slow loading data of simple table on dashboard.
Fixed wrong average strength value calculation in some cases.
Refactoring and many other improvements.
Version 4.0 2021.12.31
Added possibility to run many instances of indicator to the same chart window.
Added application source description for all notifications, it helps to identify from which instance of indicator a notification was thrown.
Added possibility to change the names of tradable pairs table's columns.
Added tracing for terminal information, broker information, MQL program information and input parameters information.
Added "Get instruments from" property for Simple Table, Sorted Table and Tradable Pairs Table to show strength only for specified instruments.
Added possibility to show Cross Lines Notification for instruments from specified symbols or specified instruments.
Added possibility to show Cross Level Notification for instruments from specified symbols or specified instruments.
Added possibility to show Tradable Pairs Notification for instruments from specified symbols or specified instruments.
Added possibility to show Currencies Strength State Notification for instruments from specified symbols or specified instruments.
Added possibility to change table head color for all tables (Simple table, Sorted table, Tradable pairs table).
Added possibility to highlight tables' timeframes cell for current chart timeframe by different color.
Added possibility to highlight tables' instruments cells for current chart symbol by different color.
Added cross level notifications for average strength from multiple timeframes.
Added cross lines notifications for average strength from multiple timeframes.
Added possibility to search crosses lines for cross lines notifications on different timeframe together at the same time (works as AND condition) like it was done for crosses levels notifications.
Added new filtering algorithm for tradable pairs searching. It's called "Symbols". It allows to search tradable pairs with pairs which are listed by user or ignore pairs which are listed by user.
Changed MA algorithm rules for search of tradable pairs (If you are using custom tradable pairs expression do not forget to update your expression according new rules for MA algorithm).
Improved indicator initialization stability.
Fixed not getting tradable pairs notifications.
Fixed not showing last tradable pair at tradable pairs table if all pairs should be shown by condition.
Fixed typo mistakes at input parameters of indicator.
Version 3.3 2021.08.21
Optimized of CSM values calculation by caching values for every update circle (7 times faster, load of CPU for CSM values calculation is reduced for 85 percent).
Added several algorithms for processing of TradablePair table's cell clicking (open pair at new chart, open pair at other chart or new one if it is not opened yet).
Added scrolling of chart to history line time if it is out of view (it allows do not lose history line).
Fixed DeMarker algorithm name.
Speed up of tradable pairs searching with MA algorithm at indicator init time and switching timeframes.
Version 3.2 2021.06.26
Added 5 properties for tradable pairs expression (this properties are concatenated together and it allows to avoid MQL limits for property length of 226 chars, now it's possible to use expression with 1130 chars length).
Version 3.1 2021.06.23
Added possibility to enable tradable pairs notifications only for specified columns.
Version 3.0 2021.06.07
Added possibility to backtest history data with history line at specified time with one minute accuracy (not only with close time of candle).
Added possibility to change Gold symbol. It allows to use any different symbol not only gold but XAG, XAU etc.
Added Bullish or Bearish direction of tradable pairs in tradable pairs notification message.
Sorting of tradable pairs alphabetically.
Adding history line object to visible list of chart objects.
Keeping history line state on chart even if indicator's properties have changed.
Momentum algorithm values for strength calculation is multiplied by 100.
RVI algorithm values for strength calculation is multiplied by 100.
Disabled ray property of history line.
Version 2.11 2021.03.31
Fixed tradable pairs finder for MA alignment algorithm if Gold is enabled.
Version 2.10 2021.03.29
Added navigation through tradable pairs by left mouse click on calls of tradable pairs table.
Added bearish and bullish coloring of tradable pairs table according to expression at indicator properties.
Added possibility to change color for bearish and bullish of tradable pairs cells.
Added bearish or bullish description next to tradable pair for Currency Strength State Notification.
Added new DM (Difference max between currencies' strength) algorithm for tradable pair search engine.
Added Moving Averages Alignment algorithm for tradable pair search engine.
Fixed D (Min Difference between currencies' strength) algorithm for tradable pair search engine for (CCI, RVI and Momentum algorithms).
Fixed indicator initialization if cross level expression is empty at indicator properties.
Version 2.2 2020.12.31
Added possibility to use multiple tradable pairs finders.
Added tradable pairs state to Currency Strength State Notification.
Added possibility to change visible rows count for tradable pairs table.
Version 2.1 2020.11.20
Fixed sending Tradable Pairs notification.
Version 2.0 2020.11.17
Added high resolution screens support (4K).
Added User Interface (UI) scaling and Font scaling.
Added support of strength identification for Gold.
Added expression based tables columns visibility, It allows to customize tables columns.
Added possibility to get notification once N period candle is closed.
Added expression based notification for levels crossing, which allows to get notifications when there is a cross on many different timeframes all at once.
Added averaging CSM values for different timeframe for tradable pairs finder.
Added support for all timeframes (M1,M2,M3,M4,M5,M6,M10,M12,M15,M20,M30,H1,H2,H3,H4,H6,H8,H12,D1,W1,MN1,Current).
Added new Currencies Strength State Notification which shows strength of all currencies as N period candle is closed.
Added averaging CSM values for Currencies Strength State Notification.
Improved history data loading. It allows to show indicator data more faster if history data is missed.
Improved logging at notifications area.
Fixed delay of dashboard data updating after timeframe switching.
Fixed updating indicator data when market is closed, when there is not any ticks.
Fixed not sending of notifications on some conditions.
Fixed typo mistakes.
Version 1.10 2020.07.09
Added auto detection of symbols suffix.
Added scale ration parameter for RSI algorithm.
Restore dashboard state when change chart symbol, timeframe, reconnection to the server and changing indicator properties.
Version 1.1 2020.05.05
Fixed chart scrolling when indicator is added.