• Overview
  • Reviews
  • Comments (27)
  • What's new

Currency Strength Meter Pro Graph for MT4

Currency Strength Meter is the easiest way to identify strong and weak currencies. This indicator shows the relative strength of 8 major currencies + Gold: AUD, CAD, CHF, EUR, GBP, JPY, NZD, USD, XAU. Gold symbol can be changed to other symbols like XAG, XAU etc.


By default the strength value is normalised to the range from 0 to 100 for RSI algorithm:

  • The value above 60 means strong currency;
  • The value below 40 means weak currency;


This indicator needs the data of all 28 major currency pairs and 9 timeframe.

Use the Expert Adviser Downloadhistory28&9 to download data automatically: https://www.mql5.com/en/blogs/post/728216


This Currency Strength Meter supports many powerful features:

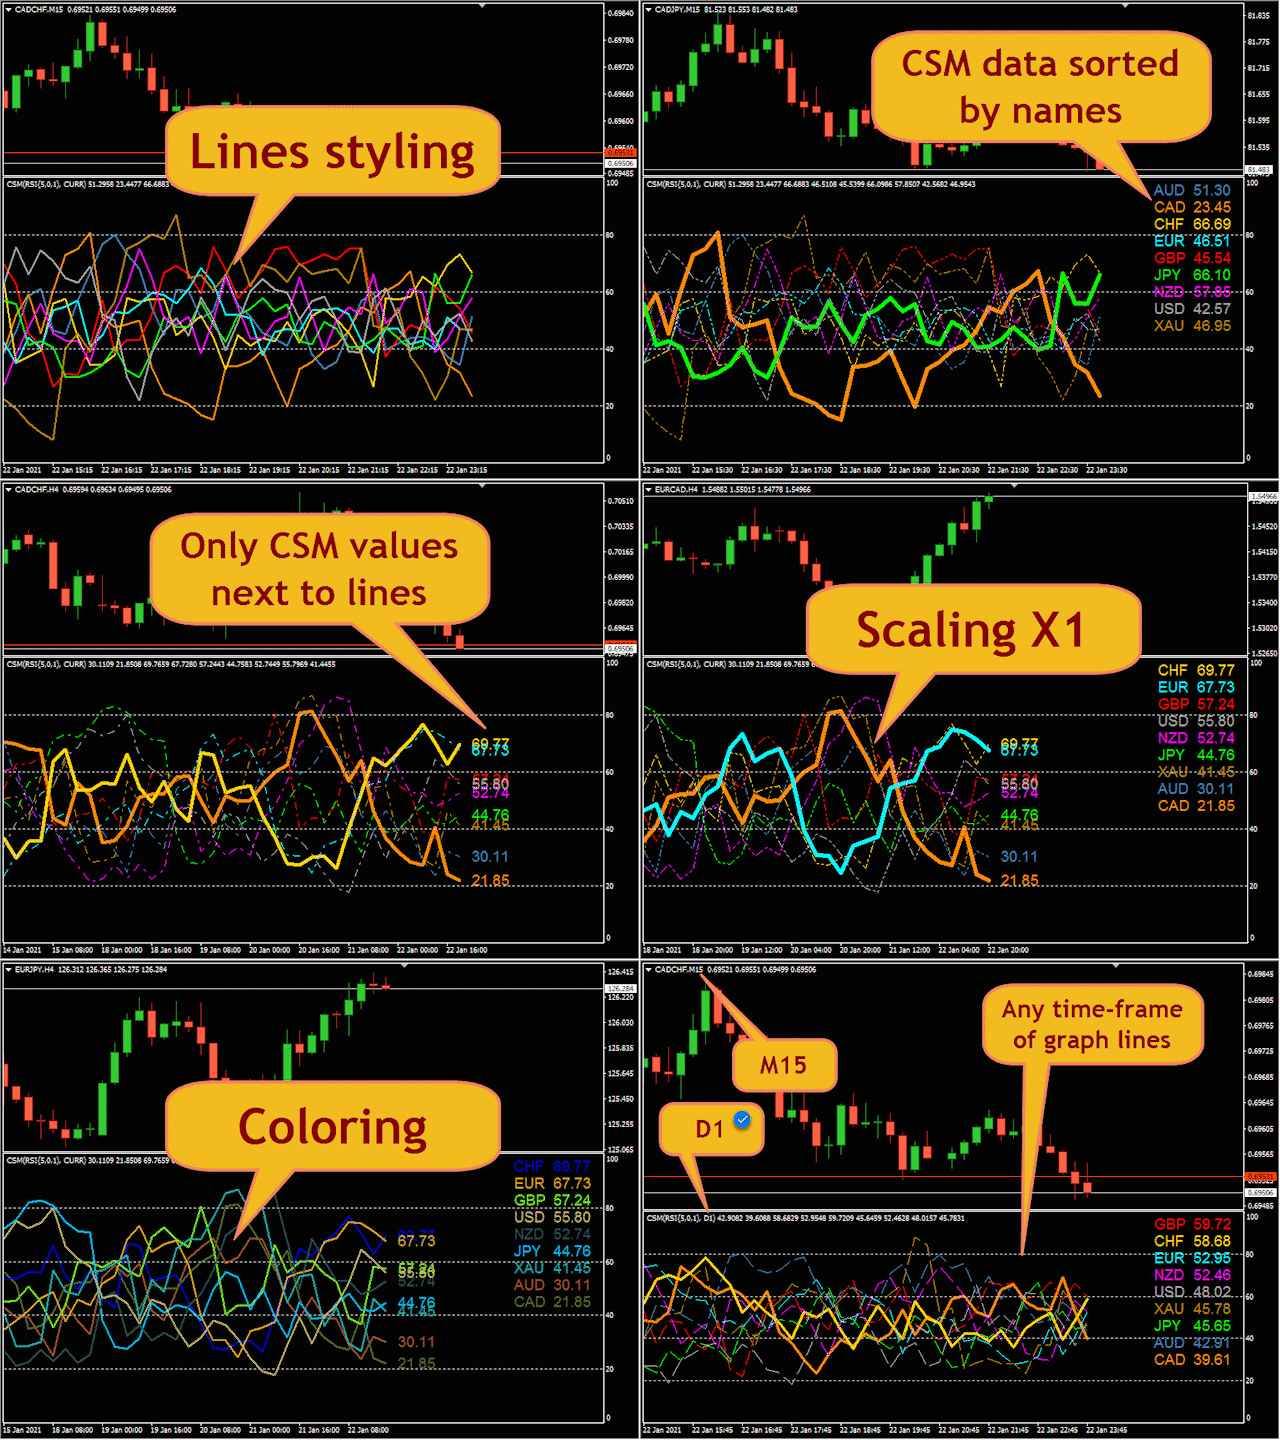
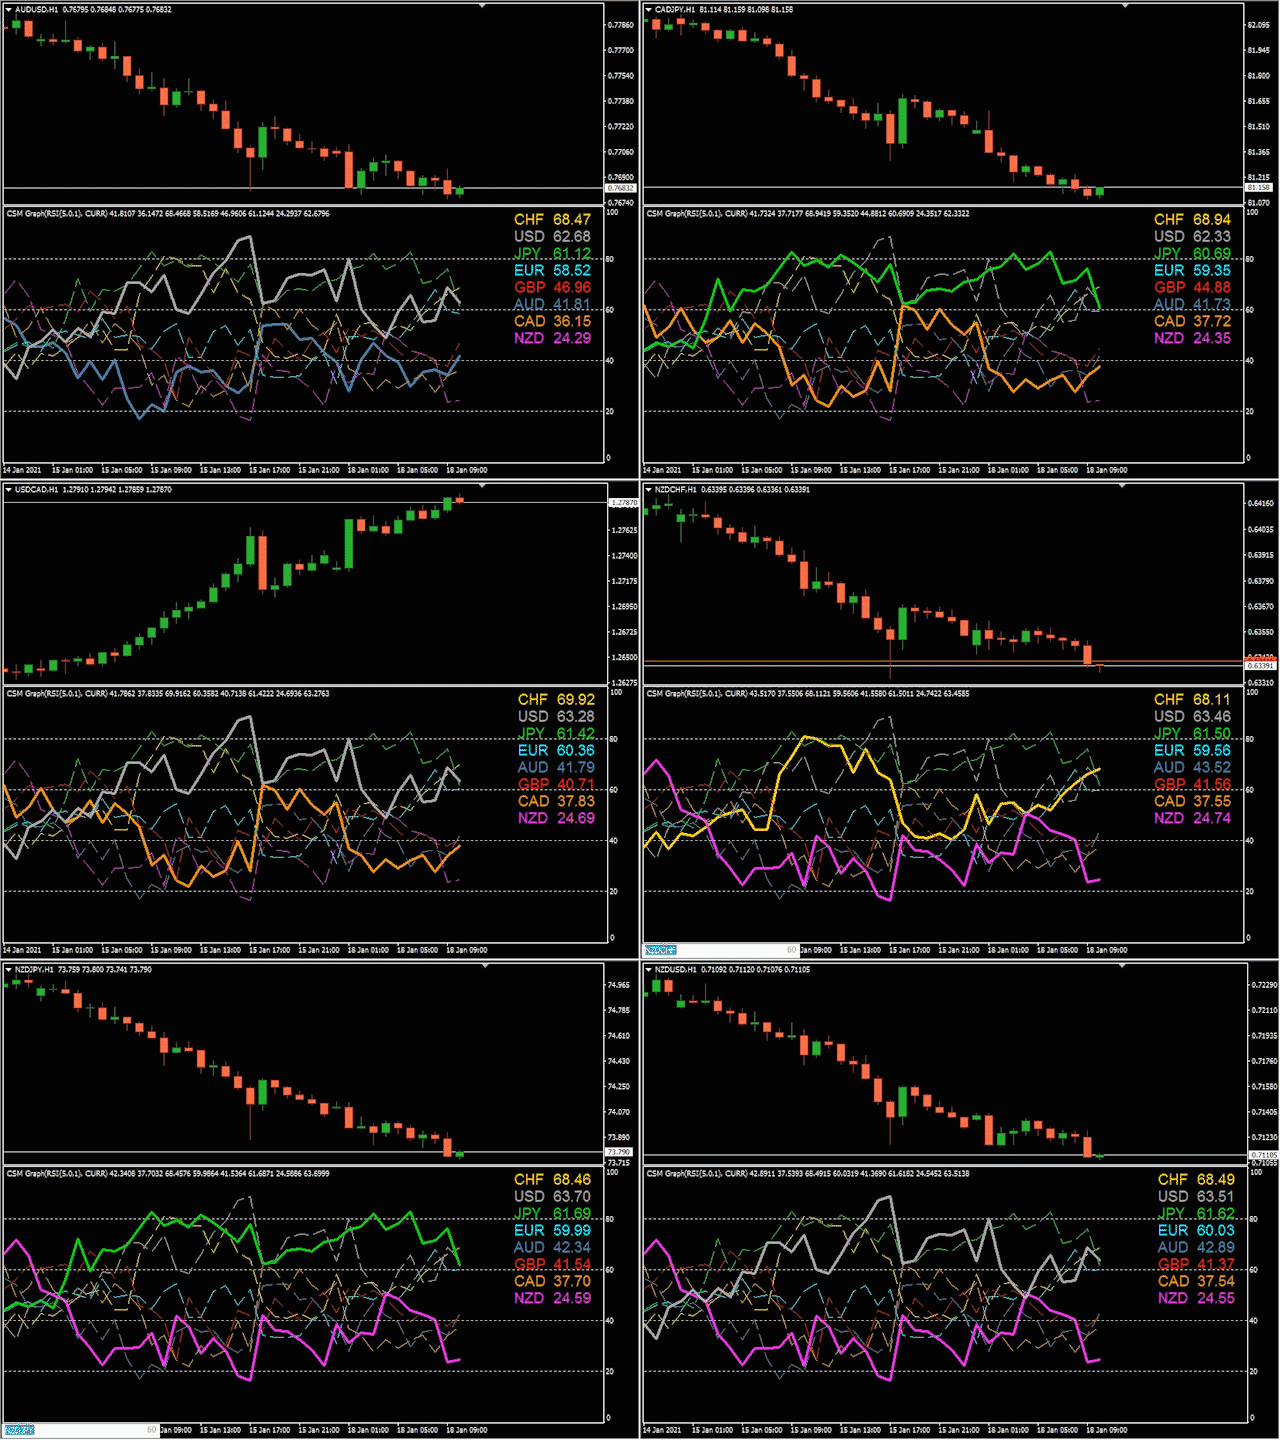
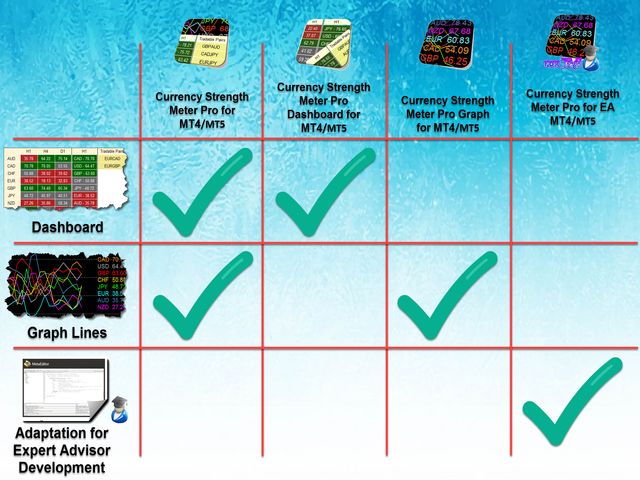
  • Currency Strength Meter Graph (shows strength of currencies with graphic lines and labels near to lines or at corner of graph);
    • Candle close time graph lines calculation;
    • Time based graph lines calculation;
  • Graph lines styling for chart symbols and other symbols;
  • Allows to calculate average currency strength from specified timeframes;
  • Searching tradable pairs by several algorithms (allows to find strong and weak currencies and show them at table as tradable pairs, you do not waste your time to do this calculation manually);
  • Powerful notification manager:
    • Notifications by crossing level (levels and timeframe is set by formula);
    • Notifications by crossing lines (timeframe is set by formula);
    • Notifications when new tradable pair is found (tradable pairs are found by formula);
    • Notifications about CSM state
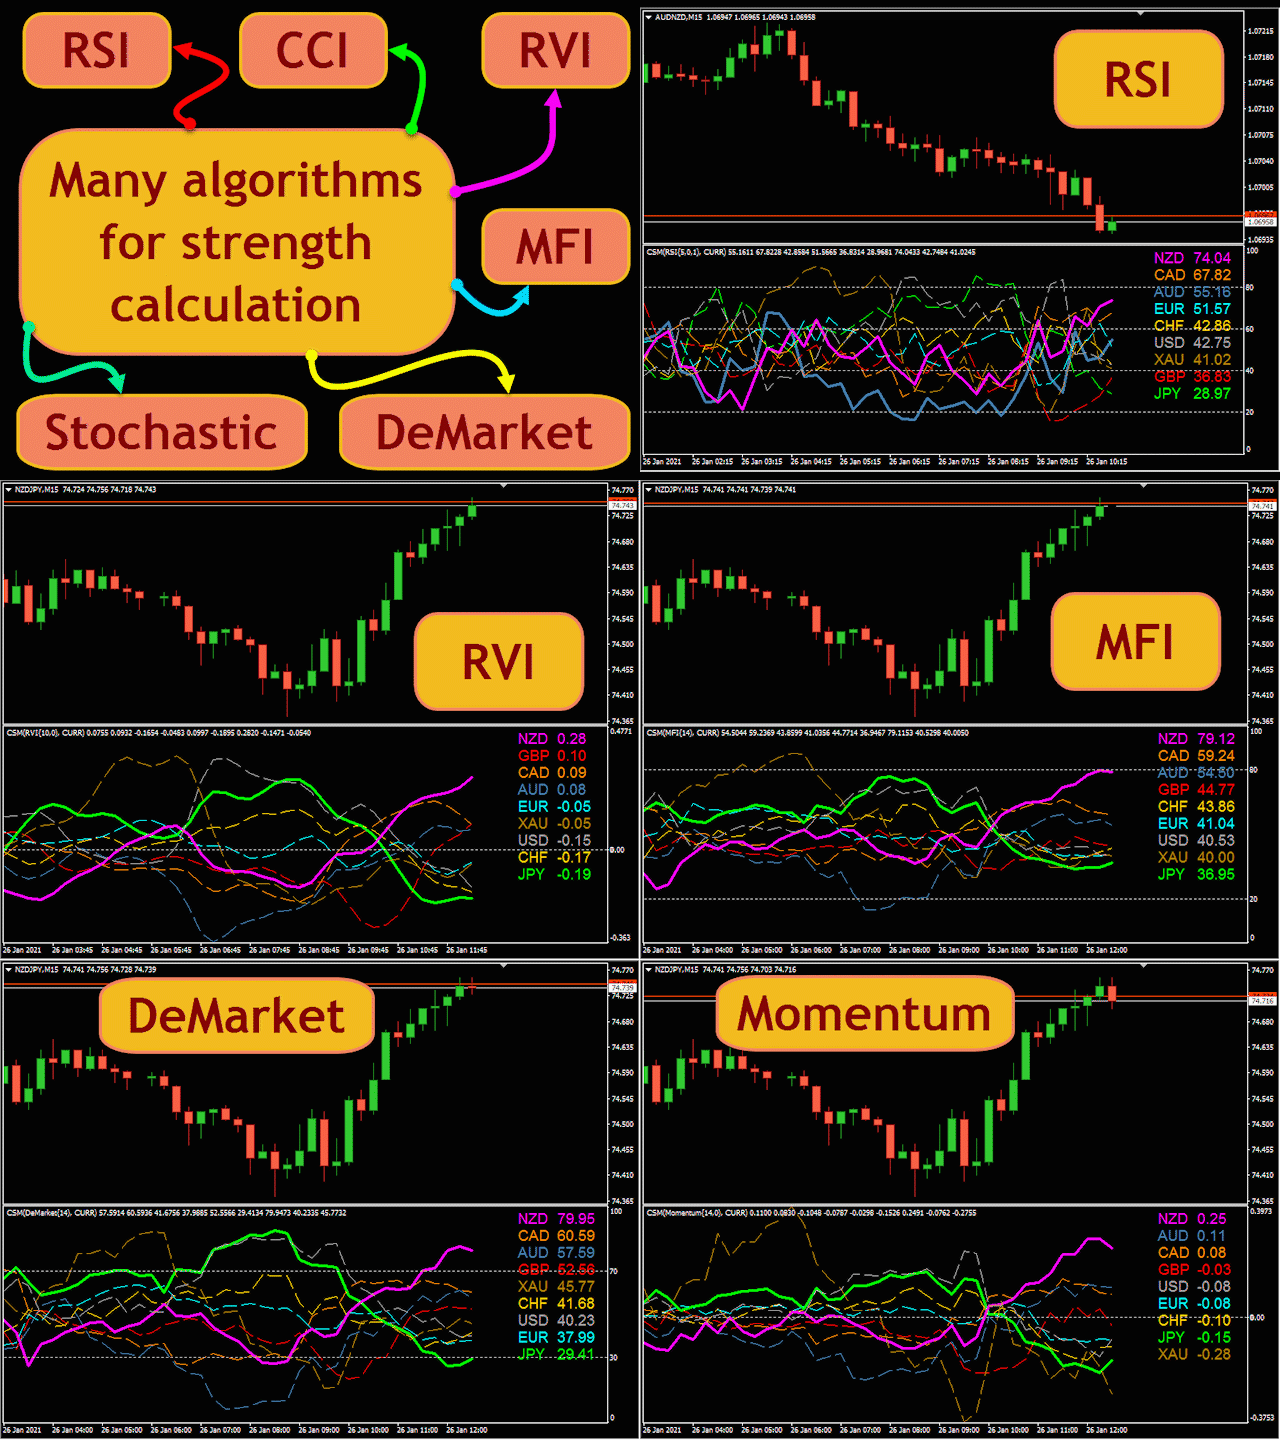
  • Many algorithms for calculation of strength of currencies (MACD, RSI, CCI, RVI, MFI, Stochastic, DeMarker, Momentum);
  • Powerful tradable pairs search engine by expression;
    • Min difference between strength of strong and weak currencies;
    • Min strength level for strong currency and weak currency;
    • Max difference between strength of strong and weak currencies;
    • Moving averages alignment;
  • Coloring of any object of Currency Strength Meter;
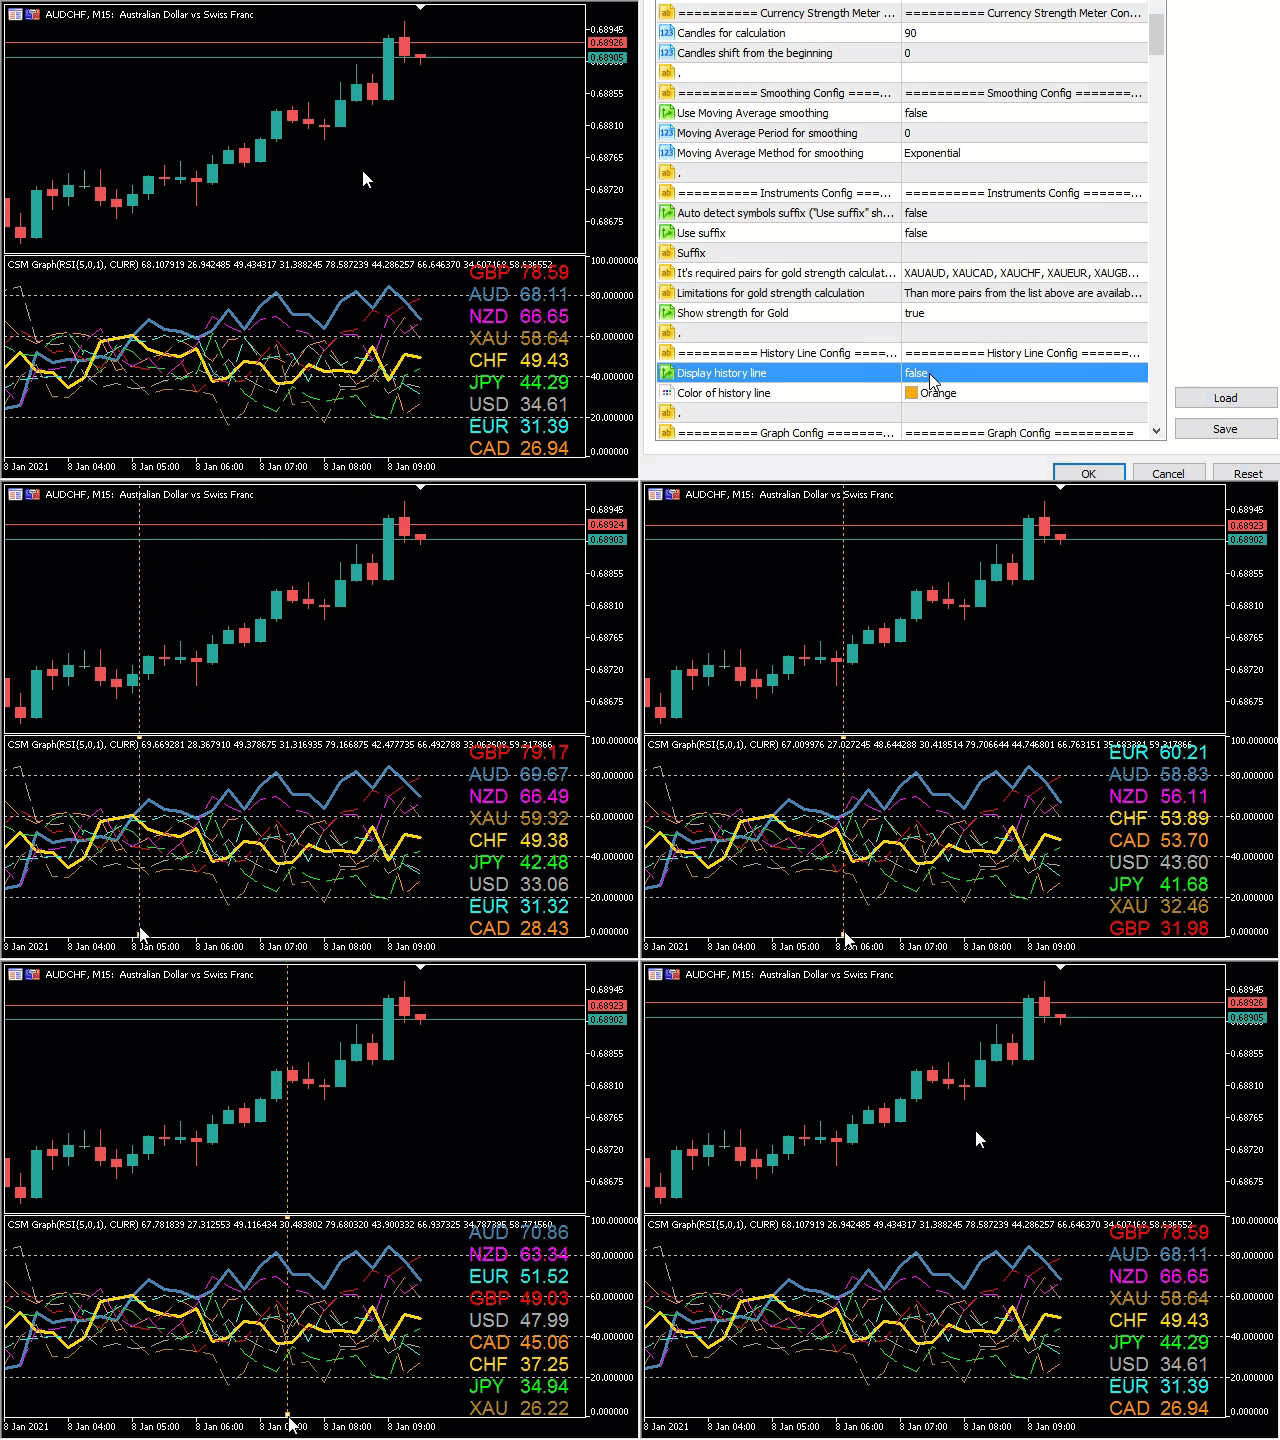
  • History line (allows to get Currency Strength Meter value for particular time in history, it helps to backtest your trading strategy with using Currency Strength Meter);
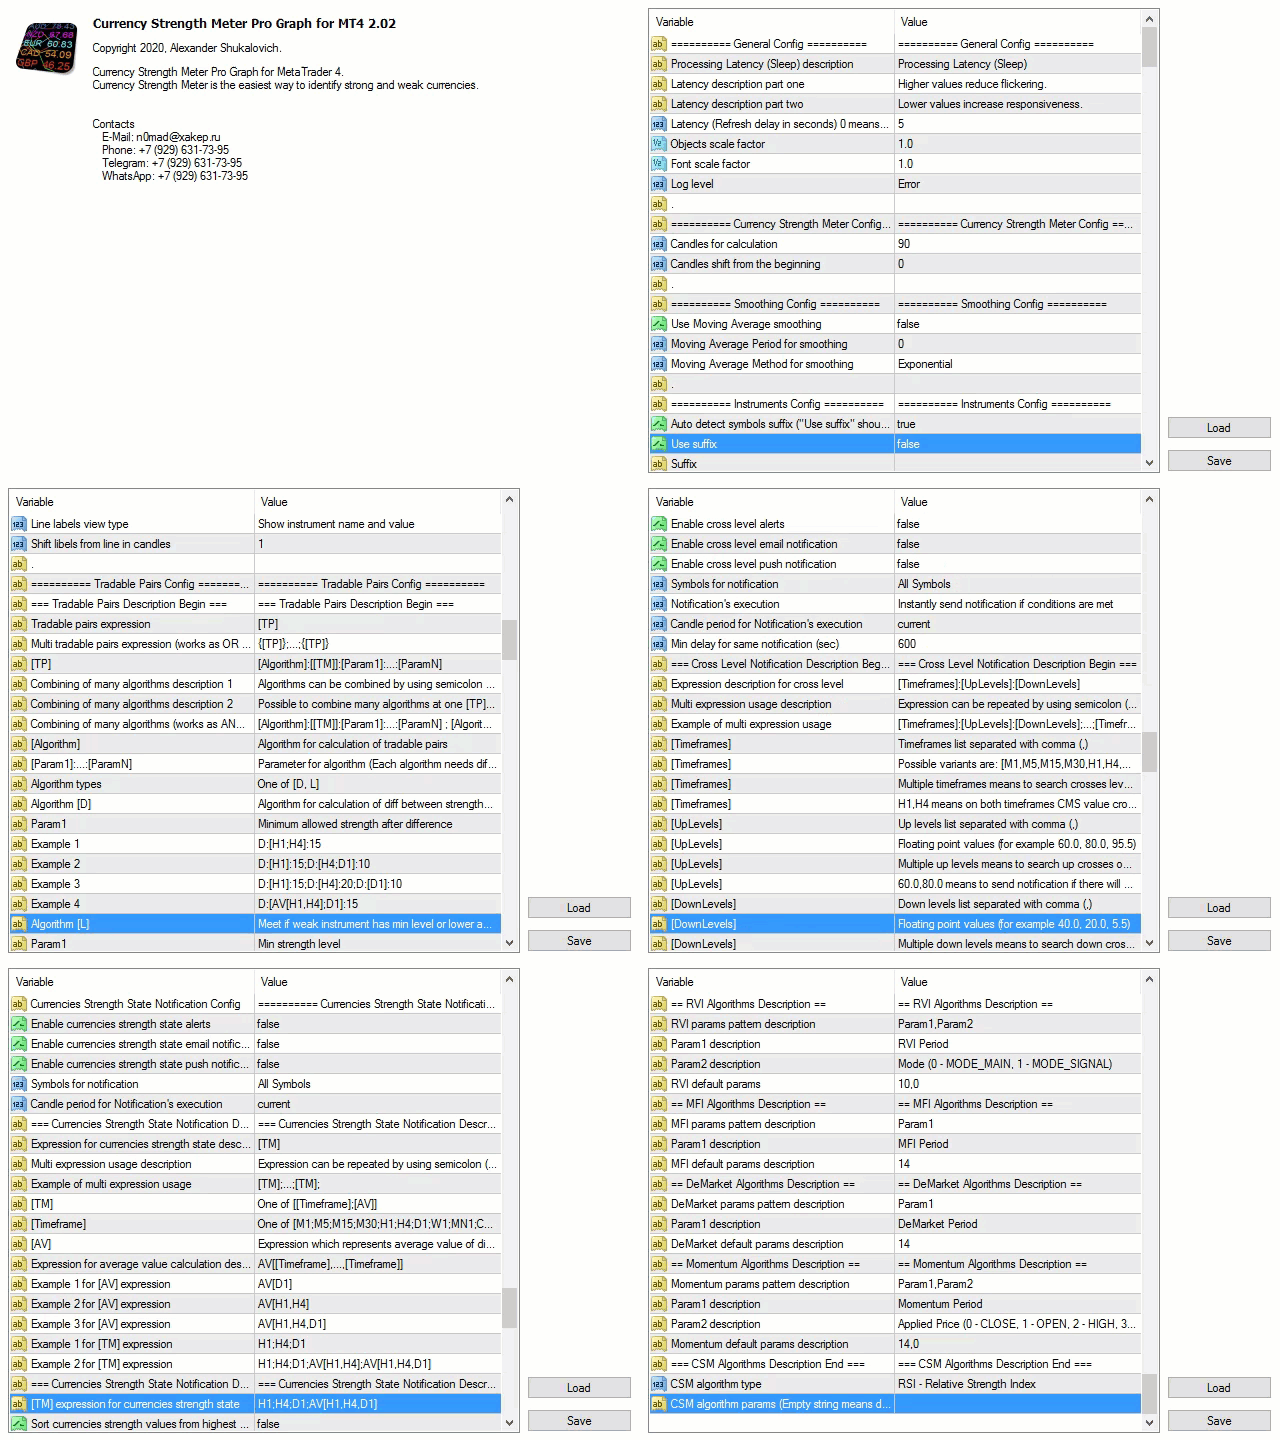
  • Moving average smoothing (allowed to smooth result with specific algorithms);
  • Latency (allowed to calculate currency strength with specified interval, thus it takes less time for calculation);
  • Allows to show data only for specified currencies (chart pair, market watch pairs, all currency pairs);
  • User-friendly interface;
  • High resolution screens support (4K)


Relative links:


Communication:

  • Join Take Profit Channel to get latest news and updates.
  • Join Take Profit Group to discuss products of author.
  • If you want new feature contact me please.


Take profit!


Recommended products
Currency Strength Meter Pro for MT4
ALEKSANDR SHUKALOVICH
4.22 (9)
Currency Strength Meter is the easiest way to identify strong and weak currencies. This indicator shows the relative strength of 8 major currencies + Gold: AUD, CAD, CHF, EUR, GBP, JPY, NZD, USD, XAU. Gold symbol can be changed to other symbols like XAG, XAU etc. By default the strength value is normalised to the range from 0 to 100 for RSI algorithm: The value above 60 means strong currency; The value below 40 means weak currency; This indicator needs the data of all 28 major currency pair
SX Currency Strength indicator allows users to analyze currency strength through a selected period, with results resetting periodically and accumulating thereafter. It displays the historical relative strength of eight major currencies (USD, EUR, GBP, JPY, AUD, CHF, CAD and NZD) across a selected timeframe. Assessing a currency's relative strength aids in evaluating its performance against a basket of other currencies. Users can select to visualize relative strength of the currencies in the shap
VR Grid
Vladimir Pastushak
5 (2)
The VR Grid indicator is designed to create a graphical grid with user-defined settings. Unlike the standard grid , VR Grid is used to build circular levels . Depending on the user's choice, the step between the round levels can be arbitrary. In addition, unlike other indicators and utilities, VR Grid maintains the position of the grid even when the time period changes or the terminal is rebooted. You can find settings, set files, demo versions, instructions, problem solving, at [blog] You can
FREE
Hello Traders, Introducing a powerful indicator designed to enhance your buy/sell decisions by combining 15 different indicators into one. This unique combination helps minimize false entries, providing you with a more reliable trading strategy. The indicator is easy to use: an upward arrow signals a buy opportunity, while a downward arrow suggests a sell. The indicator is highly versatile and can be applied to any currency pair and any timeframe. However, for optimal performance, I recommend us
VPO Profile MT4
Kyra Nickaline Watson-gordon
5 (2)
Definition : VPO is a Volume Price Opportunity. Instead of using bars or candles with an Open, High, Low, and Close price, each "bar" in a Market Profile is represented by horizontal bars against the price It is called Market Profile terminology. In other words volume-price-opportunity (VPO) profiles are histograms of how many volumes were traded at each price within the span of the profile. By using a VPO chart, you are able to analyze the amount of trading activity, based on volume, for eac
This indicator is designed to determine the time of the greatest trading activity within a day. After this calculation, the indicator builds the most significant trading levels. Comparing these levels with actual price action can provide information about the strength and direction of market trends. Features of the indicator Timeframe must be below D1. Recommended timeframes: M15, M30 and H1. Timeframes above H1 can give a very rough picture. And the use of timeframes below M15 can lead to sh
ProbabilityRiskManagedEA
Pranav Sanghadia
1 (1)
Probability and risk management based trading algorithm EA. This EA works on any timeframe, in fact it does not take the timeframe in account. Please backtest and generate the optimized values for your MT4 broker.  Please use the optimized input parameters only for the given currency pair and don't modify TP or SL once the trade is placed. As per the probability of coin flip the buy and sell orders will be equal in some time, the EA remains profitable because of the optimized parameters. 
FREE
This multicurrency indicator is the Lite version of the Cosmic Diviner Reversal Zone Pro indicator. The indicator is based on original formulas for analyzing the volatility and price movement strength. This allows determining the overbought and oversold states of instruments with great flexibility, as well as setting custom levels for opening buy or sell orders when the overbought or oversold values of the instruments reach a user-defined percentage. A huge advantage of Reversal Zone Lite is the
FlySystemEA Pro
Nikolaos Pantzos
3.27 (11)
This Expert Advisor is a pure scalping system. The expert place and manage pending orders. Runs perfect on pairs with tight spread and low commission broker (commission plus spread equal or less than 1.0 pip). Choose a broker with zero stop level and fast execution to use expert. Pairs and Time Frame Pair: eurusd Time frame: M1 Default settings are good for eurusd. Information Please test expert on demo account first, before uses it on real account. Have on your mind, all scalpers are sensi
FREE
Volume Candles
Alexander Nikolaev
Volumes are one of the most important factors of trading, as it is the high volumes that move the market in either direction. But there are very few standard indicators for volumes in MetaTrader 4. The Volume Candles analyses the volumes of the trades and displays candles depending on these volumes. The candle appears once the required number of volumes has passed during trading (the VolumeCandle parameter). If the candles close frequently and are thin, then the volumes on the market are current
SL Currency Heatmap
Chalin Saranga Jayathilake
5 (5)
Back testing can't; get indicator full performance  Trading the currency markets is a complex business. With so many pairs and multiple timeframes it is almost impossible to monitor them all – but with with the Currency Heatmap you can. The Currency Heatmap indicator delivers the information you need to base your trading decisions on the entire spectrum of currency pairs derived from the 8 major currencies; namely the US dollar, the Euro, the British Pound, the Swiss Franc, the Japanese Yen,
Currency Heat Wave Ultimate
Thushara Dissanayake
5 (1)
The Currency Heat Wave Ultimate technical indicator is a valuable tool that provides traders with real time insights into the strength of major currencies. With its analysis of 28 currency pairs, it offers a comprehensive overview of currency strength directly on the chart, making it incredibly convenient to use. By dynamically changing colors, it enables traders to quickly identify the positions of currencies and make informed decisions. One of the notable features of Currency Heat Wave is its
The indicator builds current quotes, which can be compared with historical ones and on this basis make a price movement forecast. The indicator has a text field for quick navigation to the desired date. Options: Symbol - selection of the symbol that the indicator will display; SymbolPeriod - selection of the period from which the indicator will take data; IndicatorColor - indicator color; Inverse - true reverses quotes, false - original view; Next are the settings of the te
MACDAD
Stanislav Korotky
This indicator provides you with MACD formula applied to volume-aware Accumulation/Distribution and OnBalance Volumes indicators. In addition to tick volumes it supports special pseudo-real volumes, synthesized for Forex symbols where real volumes are unknown. More details on the volume surrogates may be found in description of another indicators - TrueVolumeSurrogate and OnBalanceVolumeSurrogate (algorithm of the latter is used internally in MACDAD for AD and OBV calculation before they proceed
IceFX VelocityMeter Mini is a very unique indicator on MetaTrader 4 platform which measures the speed of the Forex market . It is not a normal volume or other measurement indicator because IceFX VelocityMeter Mini is capable to understand market speed movements which are hidden in ticks and those valuable information cannot be read in an ordinary way from the candles. The software monitors the received ticks (frequency, magnitude of change) within a specified time range, analyzes these info and
The RSI Panel MTF indicator has been created in order to have the ability to monitor the values of the standard RSI indicator from a multitude of timeframes and symbols on a single chart, as well as to receive timely notifications about the trading opportunities using an audio signal or a notification. The indicator can output both the indicator values, and only the indicator signals (confirmed and expected). A user-friendly feature for selecting the required symbol has been implemented - simply
Simply The Best Pro
Szymon Palczynski
5 (1)
This indicator displays the histogram and arrows on chart. When Simple The Best Pro are placed on a chart, they identify the trend.  The color of may be blue or red. The blue color stands for upside moves and the red color stands for downside trends. The indicator offers to set Stop Loss (SL) and  Take Profit (TP)  setting. The default value is ATR. Indicator has automatic optimization. The STB is a unique indicator that shows the tendency (button Bars) of a particular signals. The STB tells us
Stratos Pali
Michela Russo
5 (1)
Stratos Pali Indicator   is a revolutionary tool designed to enhance your trading strategy by accurately identifying market trends. This sophisticated indicator uses a unique algorithm to generate a complete histogram, which records when the trend is Long or Short. When a trend reversal occurs, an arrow appears, indicating the new direction of the trend. Important Information Revealed Leave a review and contact me via mql5 message to receive My Top 5 set files for Stratos Pali at no cost! D
The Signal Strength Meter is a Multi-Currency, Dual Timeframe Interactive Indicator, which calculates the strength of buy and sell signals, and displays a score for each symbol on a display board. Get a 7-Day Free Trial Version:  Click  Here  (Full Access to The Indicator for 7 Days) Check Video Below For Complete Demonstration, and User Manual here . Key Features: Allows you to see multiple currency signals from one chart Analyses the signals from more than a dozen classic indicators Identi
SuperTrend Classic
Eduardo Mellado Monge
The classic SuperTrend indicator. The best indicator to define trends and small-scale trend changes in any pair and time frame. It is set up in exactly the same way as the TradinView indicator, and can be adjusted and complemented with other indicators to create profitable strategies or expert advisors, or used individually to profit from the market. Based on the average volatility of the last candles and the price movement, it draws a green line below the price if an bullish microtrend is ident
Currency Strength Meter is the easiest way to identify strong and weak currencies. The indicator shows the relative strength of 8 major currencies: AUD, CAD, CHF, EUR, GBP, JPY, NZD, USD. By default the strength value is normalised to the range from 0 to 100 for RSI algorithm: The value above 60 means strong currency; The value below 40 means weak currency; The indicator is created and optimized for using it externally at an Expert Advisors or as a Custom Indicator inside your programs. For
MarketProfile EForex
Veridiana Adorno Kendrick
Market Profile Shows where the price has spent more time, highlighting important levels that can be used in trading. It is a powerful tool which is designed to take the fundamental components which comprise every market; price/volume/time, and visually display their relationship in real-time as the market develops for a pre-determined time period. Very powerful tool!
Master Scalping M1 is an innovative indicator that uses an algorithm to quickly and accurately determine the trend.The indicator calculates the time of opening and closing positions, the indicator's algorithms allow you to find the ideal moments to enter a deal (buy or sell an asset), which increase the success of transactions for most traders. Benefits of the indicator: Easy to assemble, does not overload the chart with unnecessary information. Can be used as a filter for any strategy. Works on
I’m excited to introduce the RSI Indicator, designed for multi-time frame monitoring! This powerful tool allows you to track Overbought and Oversold conditions in real-time, all on a single screen. My hope is that this indicator will assist you in your analysis and help you seize trading opportunities with your own trading system. If you find this indicator valuable, I’d greatly appreciate your support by liking my channel and giving it a 5-star rating! Your feedback motivates me to continue im
FREE
Skalpex
Andrey Kozak
Skalpex is a system indicator for wave diagnostic analysis of the early phases of a market condition. The indicator lags exactly 1 bar. It shows the exact price reversals, does not redraw its values, but is 1 bar late. This is due to the fact that the last (zero bar) has not yet been formed before closing, which means that no one ever knows where it will go exactly and where it will close. We can assume. In order not to try to play fortune-telling, the Skalpex indicator is late by one candle an
Blahtech Market Profile
Blahtech Limited
4.56 (16)
Was: $249  Now: $99   Market Profile defines a number of day types that can help the trader to determine market behaviour. A key feature is the Value Area, representing the range of price action where 70% of trading took place. Understanding the Value Area can give traders valuable insight into market direction and establish the higher odds trade. It is an excellent addition to any system you may be using. Blahtech Limited presents their Market Profile indicator for the MetaTrader community. Ins
Tick Speed Pro
John Louis Fernando Diamante
Tick Speed Pro povides a charted record of tick speed to allow you to see the ebb and flow of market activity. Observing patterns in tick speed may allow you to better time entries to reduce slippage and re-quotes. The tick speed plot updates it's entire position to show you only the last N seconds you choose, ideal for scalping and HFT approaches. An alert is provided to signal when the instrument is getting ticks at a higher rate than the alert limit. Multiple loadings are supported to compar
TrendCompass is a powerful indicator for trading in the currency and cryptocurrency markets on the MetaTrader 4 platform. This innovative tool is designed to simplify analysis and decision-making in trading. The indicator combines various technical indicators and algorithms to provide accurate and timely trading signals. Key Features: Multilevel Strategy: TrendCompass is based on a comprehensive strategy that includes analyzing major trends, support and resistance levels, and various technical
The trading statistics indicator notifies the trader of the aggregate income of the trading account for different time intervals. The indicator has wide display settings on the graph. There is a choice of one of the two display languages on the chart- English and Russian. Settings Indicator language (ENG, RUS) - Select the language to display on the chart; To control the magic (-1: any magic) - Entering the Magic for control (-1: any Magic); Angle of indicator tie - Selecting the angle of the
TICK offline
Vladimir Skorina
Indicator for collecting and storing ticks from the real market. Ticks are available in offline mode. The tick chart works like the standard time charts in MetaTrader 4. All indicators work on the tick chart. It is good for finding "pins" and spikes before the news releases. The indicator is good for scalpers and scalper systems. Templates also work. Settings: Period. - number of the period for collecting ticks. Default value is 2. You cannot use the standard minutes 1, 5, 15, 30, 60(hour), 240(
Buyers of this product also purchase
Gann Made Easy
Oleg Rodin
4.83 (92)
Gann Made Easy is a professional and easy to use Forex trading system which is based on the best principles of trading using the theory of W.D. Gann. The indicator provides accurate BUY and SELL signals including Stop Loss and Take Profit levels. You can trade even on the go using PUSH notifications. PLEASE CONTACT ME AFTER PURCHASE TO GET MY TRADING TIPS PLUS A GREAT BONUS! Probably you already heard about the Gann trading methods before. Usually the Gann theory is a very complex thing not only
- Real price is 80$ - 40% Discount ( It is 49$ now ) Contact me for instruction, add group and any questions! Related Products:  Bitcoin Expert , Gold Expert Introduction The breakout and retest strategy is traded support and resistance levels. it involves price breaking through a previous level.  The break and retest strategy is designed to help traders do two main things, the first is to avoid false breakouts. Many false breakouts start with a candlestick that breaks out of a level but ends w
Bull versus Bear
Mohamed Hassan
4.8 (5)
Official Release price of $65 for the first 27 /3 0  copies (3 copies left). Next price is $120 !  Send us a message after your purchase to receive more information on how to get your  BONUS  for FREE  that works in great combination with Bull vs Bear ! Bull versus Bear is an easy-to-use Forex indicator that gives traders clear and accurate signals based on clear trend retests . Forget about lagging indicators or staring at charts for hours because  Bull vs Bear provides real-time entries w
FX Volume
Daniel Stein
4.58 (33)
Visit our all-new   Stein Investments Welcome Page   to get the latest information, updates and trading strategies. FX Volume is the FIRST and ONLY volume indicator that provides a REAL insight into the market sentiment from a broker's point of view. It provides awesome insights into how institutional market participants, like brokers, are positioned in the Forex market, much faster than COT reports. Seeing this information directly on your chart is the real game-changer and breakthrough solut
Atomic Analyst
Issam Kassas
5 (2)
First of all Its worth emphasizing here that this Trading Indicator is   Non-Repainting , Non Redrawing and Non Lagging Indicator   Indicator, Which makes it ideal from both manual and robot trading.  User manual: settings, inputs and strategy . The Atomic Analyst  is a PA Price Action Indicator that uses Strength and Momentum of the price to find a better edge in the market. Equipped with Advanced filters which help remove noises and false signals, and Increase Trading Potential. Using Multipl
TPSpro RFI Levels
Roman Podpora
4.82 (22)
A key element in trading is zones or levels from which decisions to buy or sell a trading instrument are made. Despite attempts by major players to conceal their presence in the market, they inevitably leave traces. Our task was to learn how to identify these traces and interpret them correctly. INSTRUCTIONS    RUS    -    ENG            R ecommended to use with an indicator   -   TPSpro  TREND PRO -  Version MT5 Main functions: Displaying active zones for sellers and buyers! The indicator show
Dynamic Forex28 Navigator
Bernhard Schweigert
5 (2)
Dynamic Forex28 Navigator - The Next Generation Forex Trading Tool CURRENTLY 49% OFF. Dynamic Forex28 Navigator is the evolution of our long-time, popular indicators, combining the power of three into one: Advanced Currency Strength28 Indicator (695 reviews) + Advanced Currency IMPULSE with ALERT (520 reviews) + CS28 Combo Signals (recent Bonus) Details about the indicator   https://www.mql5.com/en/blogs/post/758844 What Does The Next-Generation Strength Indicator Offer? Everything you loved
Scalper Inside PRO
Alexey Minkov
4.73 (56)
An exclusive indicator that utilizes an innovative algorithm to swiftly and accurately determine the market trend. The indicator automatically calculates opening, closing, and profit levels, providing detailed trading statistics. With these features, you can choose the most appropriate trading instrument for the current market conditions. Additionally, you can easily integrate your own arrow indicators into Scalper Inside Pro to quickly evaluate their statistics and profitability. Scalper Inside
TPSproTREND PrO
Roman Podpora
4.79 (19)
TPSpro TRENDPRO  - is a trend indicator that automatically analyzes the market and provides information about the trend and each of its changes, as well as giving signals for entering trades without redrawing! The indicator uses each candle, analyzing them separately. referring to different impulses - up or down impulse. Exact entry points into transactions for currencies, crypto, metals, stocks, indices!  Version MT5             DETAILED DESCRIPTION              R ecommended to use with an indi
FX Levels is an exceptionally accurate support and resistance indicator that merges the traditional Lighthouse method with an innovative dynamic approach, functioning flawlessly across all trading symbols. This includes currency pairs, indices, stocks, or commodities. FX Levels identifies reversal points and displays them on the chart, which can be ideally utilized as profit targets in your trading activities. In developing FX Levels, we have used our extensive experience with brokers and the v
The Stochastic Basket Currency Strenght  brings the Stochastic indicator to a new level.  Expanding the boundaries of TimeFrames and mono-currency analysis, the SBCS take the movements of each currency that composes the cross and confront them in the whole basket of 7 crosses.  The indicator works with any combination of AUD, CAD, CHF, EUR, GBP, JPY, NZD, USD pairs and with full automation takes in account every stochastic value (main line) for the selected Time Frame.  After that, the indicator
Trend Screener
STE S.S.COMPANY
4.81 (88)
Unlock the Power of Trends Trading with the Trend Screener Indicator: Your Ultimate Trend Trading Solution powered by Fuzzy Logic and Multi-Currencies System! Elevate your trading game with the Trend Screener, the revolutionary trend indicator designed to transform your Metatrader into a powerful Trend Analyzer. This comprehensive tool leverages fuzzy logic and integrates over 13 premium features and three trading strategies, offering unmatched precision and versatility. LIMITED TIME OFFER : Sup
FX Power MT4 NG
Daniel Stein
5 (13)
Trading GOLD, and currencies, with the dog walk strategy  - super smart Trading GOLD, and currencies, with the breakout strategy  - super easy Visit our all-new   Stein Investments Welcome Page   to get the latest information, updates and trading strategies. FX Power MT4 NG  is the next generation of our long-time very popular currency strength meter, FX Power.  And what does this next-generation strength meter offer? Everything you have loved about the original FX Power  PLUS GOLD/XAU stre
Introducing ON Trade Waves Patterns Harmonic Elliot Wolfe, an advanced indicator designed to detect various market patterns using both manual and automated methods. Here's how it works: Harmonic Patterns: This indicator can identify harmonic patterns that appear on your chart. These patterns are essential for traders practicing harmonic trading theory, as popularized by Scott Carney's book "Harmonic Trading vol 1&2." Whether you draw them manually or rely on automated detection, ON Trade Waves
ACB Breakout Arrows
KEENBASE SOFTWARE SOLUTIONS
4.15 (34)
The ACB Breakout Arrows indicator provides a crucial entry signal in the market by detecting a special breakout pattern. The indicator constantly scans the chart for a settling momentum in one direction and provide the accurate entry signal right before the major move.  Get multi-symbol and multi-timeframe scanner from here - Scanner for ACB Breakout Arrows MT4 Key features Stoploss and Take Profit levels are provided by the indicator. Comes with a MTF Scanner dashboard which tracks the brea
Advanced Supply Demand
Bernhard Schweigert
4.91 (295)
CURRENTLY 26% OFF !! Best Solution for any Newbie or Expert Trader! This indicator is a unique, high quality and affordable trading tool because we have incorporated a number of proprietary features and a new formula. With this update, you will be able to show double timeframe zones. You will not only be able to show a higher TF but to show both, the chart TF, PLUS the higher TF: SHOWING NESTED ZONES. All Supply Demand traders will love it. :) Important Information Revealed Maximize the potenti
Gold Channel is a volatility-based indicator, developed with a specific timing algorithm for the XAUUSD pair, which consists of finding possible corrections in the market. This indicator shows two outer lines, an inner line (retracement line) and an arrow sign, where the theory of the channel is to help identify overbought and oversold conditions in the market. The market price will generally fall between the boundaries of the channel. If prices touch or move outside the channel it is a tra
Scalper Vault
Oleg Rodin
5 (27)
Scalper Vault is a professional scalping system which provides you with everything you need for successful scalping. This indicator is a complete trading system which can be used by forex and binary options traders. The recommended time frame is M5. The system provides you with accurate arrow signals in the direction of the trend. It also provides you with top and bottom signals and Gann market levels. The indicator provides all types of alerts including PUSH notifications. PLEASE CONTACT ME AFT
Ultimate Gold Advisor for MetaTrader 4 The Ultimate Gold Advisor is an advanced technological tool designed to optimize the trading experience on MetaTrader 4. Created to meet the needs of experienced traders, this indicator combines precision, sophisticated analysis, and versatile functionality, offering support for informed trading decisions. Ideal for gold trading but also applicable across a wide range of assets, the Ultimate Gold Advisor can help you improve your market strategies. What ma
This dashboard shows the latest available harmonic patterns for the selected symbols, so you will save time and be more efficient / MT5 version . Free Indicator:   Basic Harmonic Pattern Comparison of "Basic Harmonic Pattern" vs. "Basic Harmonic Patterns Dashboard" Indicators Feature Basic Harmonic Pattern Basic Harmonic Patterns Dashboard Functionality Detects and displays harmonic patterns on a single chart Searches multiple symbols and timeframes for harmonic patterns, displays result
PLEASE READ THE INFO DOWN BELOW BEFORE PURCHASING THE PRODUCT! Apollo Pips PLUS SP is a unique product!  IT IS FOR THOSE WHO WANT TO GET MY NEW "APOLLO PIPS" INDICATOR PLUS "SUPER PACK" BONUS WITH ACCESS TO ALL MY TRADING INDICATORS! By purchasing the Apollo Pips PLUS SP product you're actually purchasing an absolutely new version of my Apollo Pips indicator. This version of the indicator has got an improved algorithm and an easy to use parameter which gives you the opportunity to use the indica
Currently 20% OFF ! Best Solution for any Newbie or Expert Trader! This dashboard software is working on 28 currency pairs plus one. It is based on 2 of our main indicators (Advanced Currency Strength 28 and Advanced Currency Impulse). It gives a great overview of the entire Forex market plus Gold or 1 indices. It shows Advanced Currency Strength values, currency speed of movement and signals for 28 Forex pairs in all (9) timeframes. Imagine how your trading will improve when you can watch the e
CURRENTLY 26% OFF Best Solution for any Newbie or Expert Trader! This Indicator is a unique, high quality and affordable trading tool because we have incorporated a number of proprietary features and a new formula. With only ONE chart you can read Currency Strength for 28 Forex pairs! Imagine how your trading will improve because you are able to pinpoint the exact trigger point of a new trend or scalping opportunity? User manual: click here That's the first one, the original! Don't buy a worthle
Currency Strength Wizard is a very powerful indicator that provides you with all-in-one solution for successful trading. The indicator calculates the power of this or that forex pair using the data of all currencies on multiple time frames. This data is represented in a form of easy to use currency index and currency power lines which you can use to see the power of this or that currency. All you need is attach the indicator to the chart you want to trade and the indicator will show you real str
TPA True Price Action indicator reveals the true price action of the market makers through 100% non-repainting signals (except early signals mode) strictly at the close of a candle! TPA shows entries and re-entries, every time the bulls are definitely stronger than the bears and vice versa. Not to confuse with red/green candles. The shift of power gets confirmed at the earliest stage and is ONE exit strategy of several. There are available now two free parts of the TPA User Guide for our custo
Market Structure Patterns MT4
Samuel Manoel De Souza
5 (16)
Market Structure Patterns   is an indicator based on   smart money concepts   that displays   SMC/ICT   elements that can take your trading decisions to the next level. Take advantage of the   alerts ,   push notifications   and   email messages   to keep informed from when an element is formed on the chart, the price crosses a level and/or enters in a box/zone. Developers can access the values of the elements of the indicator using the   global variables  what allows the automation of trading
Gann Swing Structure
Kirill Borovskii
5 (1)
This indicator is based on the mathematics of the great trader W.D. Ganna. With its help, you can easily find strong levels by analyzing swings to find the optimal entry point. The indicator works on all instruments and all timeframes. The indicator is fully manual and has control buttons. All you need to do is press the NEW button, a segment will appear, which you can place on any movement, swing or even 1 candle that you want to analyze. By placing the segment, press the OK button. A grid (th
IX Power MT4
Daniel Stein
5 (5)
IX Power finally brings the unbeatable precision of FX Power to all your trading symbols. It accurately determines the intensity of short, medium and long-term trends in your favourite indices, stocks, commodities, ETFs, and even cryptocurrencies. You can analyse everything your terminal has to offer. Try it out and experience how your timing improves significantly when trading. Read about our latest strategic development -  Easy scalping with IX Power Visit our all-new   Stein Investments
Leave a Comment after purchase to get 4 high quality indicators as Bonus. The Chart Patterns All-in-One indicator helps traders visualize various chart patterns commonly used in technical analysis. It supports identifying potential market behaviors, but profitability is not guaranteed. Testing in demo mode is recommended before purchasing. Current Offer : 50% discount on the "Chart Patterns All in One" indicator. Included Patterns : Pattern 1-2-3 : Detects market reversals using three key point
Supply and Demand Dashboard PRO
Bernhard Schweigert
4.8 (20)
Currently 20% OFF ! This dashboard is a very powerful piece of software working on multiple symbols and up to 9 timeframes. It is based on our main indicator (Best reviews:   Advanced Supply Demand ). The dashboard gives a great overview. It shows: Filtered Supply and Demand values including zone strength rating, Pips distances to/and within zones, It highlights nested zones, It gives 4 kind of alerts for the chosen symbols in all (9) time-frames. It is highly configurable for your personal
More from author
Currency Strength Meter is the easiest way to identify strong and weak currencies. This indicator shows the relative strength of 8 major currencies + Gold: AUD, CAD, CHF, EUR, GBP, JPY, NZD, USD, XAU. Gold symbol can be changed to other symbols like XAG, XAU etc. By default the strength value is normalised to the range from 0 to 100 for RSI algorithm: The value above 60 means strong currency; The value below 40 means weak currency; This indicator needs the history data of all 28 major currenc
Currency Strength Meter is the easiest way to identify strong and weak currencies. This indicator shows the relative strength of 8 major currencies + Gold: AUD, CAD, CHF, EUR, GBP, JPY, NZD, USD, XAU. Gold symbol can be changed to other symbols like XAG, XAU etc. By default the strength value is normalised to the range from 0 to 100 for RSI algorithm: The value above 60 means strong currency; The value below 40 means weak currency; This indicator needs the data of all 28 major currency pairs
Currency Strength Meter Pro for MT4
ALEKSANDR SHUKALOVICH
4.22 (9)
Currency Strength Meter is the easiest way to identify strong and weak currencies. This indicator shows the relative strength of 8 major currencies + Gold: AUD, CAD, CHF, EUR, GBP, JPY, NZD, USD, XAU. Gold symbol can be changed to other symbols like XAG, XAU etc. By default the strength value is normalised to the range from 0 to 100 for RSI algorithm: The value above 60 means strong currency; The value below 40 means weak currency; This indicator needs the data of all 28 major currency pair
Currency Strength Meter is the easiest way to identify strong and weak currencies.   The   indicator shows the relative strength of 8 major currencies: AUD, CAD, CHF, EUR, GBP, JPY, NZD, USD. By default the strength value is normalised to the range from 0 to 100 for RSI algorithm: The value above 60 means strong currency; The value below 40 means weak currency; The indicator is created and optimized for using it externally at an Expert Advisors or as a Custom Indicator inside your programs.
Trend Power for MT4
ALEKSANDR SHUKALOVICH
4.67 (3)
Trend Power Indicator is an indicator which helps to identify trend direction and its power by using moving averages ZigZag pattern and correlations of tradable instruments. It provides trend power data with user-friendly interface which can be read easily and fast.   This indicator by default is configured for trading of Adam Khoo's ( Piranhaprofit ) strategies. It saves mass of time for searching of tradable pairs by his strategies. It indicates when all required moving averages are alignment
Currency Strength Meter is the easiest way to identify strong and weak currencies. This indicator shows the relative strength of 8 major currencies + Gold: AUD, CAD, CHF, EUR, GBP, JPY, NZD, USD, XAU. Gold symbol can be changed to other symbols like XAG, XAU etc. By default the strength value is normalised to the range from 0 to 100 for RSI algorithm: The value above 60 means strong currency; The value below 40 means weak currency; This indicator needs the history data of all 28 major curren
News Scalping Executor is an advisor which helps to trade news with high impact and huge volatility. This advisor helps to create two opposite orders with risk management. It moves automatically stop loss level to avoid losses as much as possible by using many different algorithms. It helps to avoid trading the news if spread suddenly becomes very huge. To be profitable with this type of trading you should choose the most volatile types of news such as: GDP, CPI, Unemployment Claims, Intere
News Scalping Executor Pro is an advisor which helps to trade news with high impact and huge volatility. This advisor helps to create two opposite orders with risk management and profit protection. It moves automatically stop loss level to avoid losses as much as possible by using many different algorithms. It helps to avoid trading the news if spread suddenly becomes very huge. It can lock profit by moving stop loss or partially closing of orders. To be profitable with this type of trading
Currency Strength Meter is the easiest way to identify strong and weak currencies. The indicator shows the relative strength of 8 major currencies: AUD, CAD, CHF, EUR, GBP, JPY, NZD, USD. By default the strength value is normalised to the range from 0 to 100 for RSI algorithm: The value above 60 means strong currency; The value below 40 means weak currency; The indicator is created and optimized for using it externally at an Expert Advisors or as a Custom Indicator inside your programs. For
Chart State Saver for MT4 is utility which helps to save states of all your charts even if they will be closed. And then all saved charts' states can be easily loaded back to charts. It stores templates for each particular currency pair and automatically applies them to charts once they will be opened at next time. Also they can be applied to the charts by your own needs. Thus you can close any chart at your MT4 without scaring to lose chart's data like drawls, messages, chart styling and so
The MA Bounce Strategy is a strategy that seeks to long FX pairs on a strong uptrend as they bounce off their MA support and shorting FX pairs on a strong downtrend as they bounce off MA resistance. The best suitable periods of moving averages for that strategy are 18, 30, 50. This indicator helps to identify and find place for potential market entry by MA bounce strategy. Read   More information about  MA Bounce Strategy . By default MA Bounce Strategy indicator is configured for trading of M1
News Scalping Executor is an utility which helps to trade high impact and huge volatility   news . This utility helps to create two opposite orders with risk management and profit protection. It moves automatically stop loss level to avoid losses as much as possible by using many different algorithms. It helps to avoid trading the news if spread suddenly becomes very huge. It can lock profit by moving stop loss or partially closing of orders. To be profitable with this type of trading you sh
News Scalping Executor Pro is an utility which helps to trade high impact and huge volatility news . This utility helps to create two opposite orders with risk management and profit protection. It moves automatically stop loss level to avoid losses as much as possible by using many different algorithms. It helps to avoid trading the news if spread suddenly becomes very huge. It can lock profit by moving stop loss or partially closing of orders. To be profitable with this type of trading you
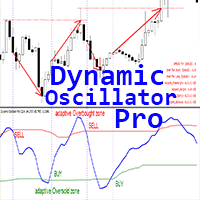
Currency Strength Meter is the easiest way to identify strong and weak currencies. This indicator shows the relative strength of 8 major currencies + Gold: AUD, CAD, CHF, EUR, GBP, JPY, NZD, USD, XAU. Gold symbol can be changed to other symbols like XAG, XAU etc. By default the strength value is normalised to the range from 0 to 100 for RSI algorithm: The value above 60 means strong currency; The value below 40 means weak currency; This indicator needs the history data of all 28 major curren
Trend Power for MT5
ALEKSANDR SHUKALOVICH
5 (1)
Trend Power Indicator is an indicator which helps to identify trend direction and its power by using moving averages ZigZag pattern and correlations of tradable instruments. It provides trend power data with user-friendly interface which can be read easily and fast.   This indicator by default is configured for trading of   Adam Khoo's   ( Piranhaprofit ) strategies. It saves mass of time for searching of tradable pairs by his strategies. It indicates when all required moving averages are align
Chart State Saver for MT5 is utility which helps to save states of all your charts even if they will be closed. And then all saved charts' states can be easily loaded back to charts. It stores templates for each particular currency pair and automatically applies them to charts once they will be opened at next time. Also they can be applied to the charts by your own needs. Thus you can close any chart at your MT5 without scaring to lose chart's data like drawls, messages, chart styling and so
The MA Bounce Strategy is a strategy that seeks to long FX pairs on a strong uptrend as they bounce off their MA support and shorting FX pairs on a strong downtrend as they bounce off MA resistance. The best suitable periods of moving averages for that strategy are 18, 30, 50. This indicator helps to identify and find place for potential market entry by MA bounce strategy.  More information about  MA Bounce Strategy can be read by this link  https://www.mql5.com/en/blogs/post/743037 .  By defau
Filter:
No reviews
Reply to review
Version 7.0 2023.12.18
Improved CCI algorithm and its coordinate system is converted to dimension from 0 to 100 values.
Improved RVI algorithm and its coordinate system is converted to dimension from 0 to 100 values.
Improved Momentum algorithm and its coordinate system is converted to dimension from 0 to 100 values.
Improved DeMarker algorithm.
Improved MACD algorithm.
Added ADX algorithm for instruments' volatility measurement (not to measure strength, the higher the value, the higher the volatility of the instrument).
Changed graph timeframes expression from "Current:[Current]" to "M1:[M5];M5:[AV[M15,M30]];M15:[H1];M30:[H4];H1:[H4];H4:[D1]" (To change it back set property "Graph timeframes expression" tp "Current:[Current]").
"Current:[Current]" expression means: for current chart timeframe show strength which would be calculated on the same timeframe;
"M1:[M5];M5:[AV[M15,M30]];M15:[H1];M30:[H4];H1:[H4];H4:[D1]" expression means:
M1:[M5] - M1 chart timeframe show graph lines which would be calculated on M5 timeframe candles for every one minute (M1);
M5:[AV[M15,M30]] - M5 chart timeframe show graph lines which would be calculated as average of M15 and M30 timeframes candles for every 5 minutes (M5);
M15:[H1] - M15 chart timeframe show graph lines which would be calculated on H1 timeframe candles for every 15 minute (M15);
Other parts of expression can be defined similar to above;
Graph lines labels are visible now by default (to hide them set property "Is graph line labels visible" to false).
Changed default font size for graph lines labels from 14 to 11 (to change it back set property "Line labels font size" to 14).
Log level changed from "Disabled" to "Error" (if you do not need logs messages you have to change property "Log level" to "Disabled").
"Update on every tick " now updates CSM data if new quote would be received for any of monitoring pairs.
Updated contact information at indicator's "About" property tab.
Added possibility to get alerts separately for all found tradable pairs.
Added seconds to notification's time in notifications signals.
Improved logging.
Improved parsing of "Graph timeframes Expression":
* Fixed indicator initialization failure if there is no binding between graph lines timeframes and current chart timeframe.
* Added possibility to set empty string to "Graph timeframes Expression", it works similar like "Current[Current]" expression.
Recompiled with new MQL compiler and others minor improvements and fixes.
Version 6.10 2023.02.28
Added possibility to change number of decimals for simple table, sorted table, graph labels and graph lines libels.
Version 6.0 2023.02.17
Added sessions time for throwing notifications.
Added possibility to choose show or not show cross lines notification for instruments' for which symbol does not exist.
Improved support of partial strength calculation if not all required history data is available.
Improved indicator work stability.
Improved trace messages.
Fixed mistype at trace messages.
Fixed algorithm of moving average value calculation.
Fixed tradable pairs searching with moving average algorithm in some cases.
Fixed not throwing of cross lines notification if at least one of 28 symbols does not exists.
Fixed out of range error in some cases.
Version 5.40 2022.10.17
Added MACD algorithm for currencies' strength value calculation.
Added LM (max level boundary) algorithm for tradable pairs searching.
Version 5.22 2022.09.11
Added possibility to show label for history line with history line's date and time.
Version 5.12 2022.08.30
Workaround incorrect GBP symbols parsing by IG broker.
Version 5.11 2022.08.23
Workaround incorrect symbol parsing by IG broker.
Version 5.10 2022.07.25
Improved strength value calculation if new candle for some pairs of 28 is appeared and for some pairs of 28 new candle is not appeared yet (haven't received new ticks for some pairs of 28 at time when new candle should be formed).
Version 5.0 2022.06.19
Added possibility to show graph lines for multiple timeframes for the same instrument at one sub-window.
Added possibility to chose speed optimization for calculation graph lines for "Time based calculation" (Set property "Use fast time based calculation" to false for dip history back testing. It's slow but very accurate. Use this method for back testing your strategy.. Set property "Use fast time based calculation" to true for fast calculation. It can show little different values dip in history. Use this method for trading.).
Added average strength calculation from different timeframes for graph lines (values of graph lines are calculated by average CSM value of specified Timeframes f.e. AV[H1,H4]).
Added possibility to use specified graph lines timeframes according to current chart timeframe (f.e. Chart timeframe M15 - graph lines timeframes AV[H1, H4];H1 or Chart timeframe H1 - graph lines timeframes AV[H4, D1];H4).
Added graph lines styling for lines of current chart timeframe.
Added graph lines styling for lines of current chart instrument and current chart timeframe at the same time.
Added possibility to show maximum available points to draw graph lines if user has requested data for more than available points by "Candles for calculation" property.
Added "Disabled" log level and it's used by default.
Added possibility to change Libels view of Graph Lines by expression with 3 different replacement variables: ${Instrument}, ${Timeframe}, ${Strength}.
Improved strength calculation speed.
Improved loading speed of graph lines by caching values.
Improved calculation speed of indicator processors for "Time based process" (if possible it passes calculation to "Index base process" which is much faster than "Time based process").
Improved log messages and added new messages to log.
Workaround incorrect symbol parsing by XM broker.
Fixed not updating indicator strength values in some cases (when history time equals to 0, transmitting to "Index base" calculation).
Fixed invalid data for drawing on graph lines if "Candles for calculation" property is set to 0.
Refactoring and many other improvements.
Version 4.0 2021.12.31
Added possibility to run many instances of indicator to the same chart window.
Added application source description for all notifications, it helps to identify from which instance of indicator a notification was thrown.
Added tracing for terminal information, broker information, MQL program information and input parameters information.
Added possibility to draw graph lines for instruments from specified symbols or specified instruments.
Added possibility to show Cross Lines Notification for instruments from specified symbols or specified instruments.
Added possibility to show Cross Level Notification for instruments from specified symbols or specified instruments.
Added possibility to show Tradable Pairs Notification for instruments from specified symbols or specified instruments.
Added possibility to show Currencies Strength State Notification for instruments from specified symbols or specified instruments.
Added cross level notifications for average strength from multiple timeframes.
Added cross lines notifications for average strength from multiple timeframes.
Added possibility to search crosses lines for cross lines notifications on different timeframe together at the same time (works as AND condition) like it was done for crosses levels notifications.
Added new filtering algorithm for tradable pairs searching. It's called "Symbols". It allows to search tradable pairs with pairs which are listed by user or ignore pairs which are listed by user.
Changed MA algorithm rules for search of tradable pairs (If you are using custom tradable pairs expression do not forget to update your expression according new rules for MA algorithm).
Fixed typo mistakes at input parameters of indicator.
Version 3.3 2021.08.21
Optimized of CSM values calculation by caching values for every update circle (7 times faster, load of CPU for CSM values calculation is reduced for 85 percent).
Added scrolling of chart to history line time if it is out of view (it allows do not lose history line).
Fixed DeMarker algorithm name.
Fixed not updating CSM values when moving history line.
Version 3.2 2021.06.26
Added 5 properties for tradable pairs expression (this properties are concatenated together and it allows to avoid MQL limits for property length of 226 chars, now it's possible to use expression with 1130 chars length).
Version 3.1 2021.06.23
Added possibility to enable tradable pairs notifications only for specified columns.
Version 3.0 2021.06.07
Added possibility to backtest history data with history line at specified time with one minute accuracy (not only with close time of candle).
Added time based graph lines calculation (It allows to show currencies strength which is calculated on specified timeframe on candle close time of current chart timeframe).
Added possibility to change Gold symbol. It allows to use any different symbol not only gold but XAG, XAU etc.
Added Bullish or Bearish direction of tradable pairs in tradable pairs notification message.
Sorting of tradable pairs alphabetically.
Adding history line object to visible list of chart objects.
Keeping history line state on chart even if indicator's properties have changed.
Momentum algorithm values for strength calculation is multiplied by 100.
RVI algorithm values for strength calculation is multiplied by 100.
Fixed out of range index error for indicator buffer for some CSM Algorithms.
Version 2.12 2021.04.05
Fixed indicator buffer index out of range error for some CSM Algorithms.
Version 2.11 2021.03.31
Fixed tradable pairs finder for MA alignment algorithm if Gold is enabled.
Version 2.10 2021.03.29
Added bearish or bullish description next to tradable pair for Currency Strength State Notification.
Added new DM (Difference max between currencies' strength) algorithm for tradable pair search engine.
Added Moving Averages Alignment algorithm for tradable pair search engine.
Fixed D (Min Difference between currencies' strength) algorithm for tradable pair search engine for (CCI, RVI and Momentum algorithms).
Fixed indicator initialization if cross level expression is empty at indicator properties.
Version 2.2 2020.12.31
Added possibility to use multiple tradable pairs finders.
Added tradable pairs state to Currency Strength State Notification.
Version 2.1 2020.11.20
Fixed sending Tradable Pairs notification.
Version 2.0 2020.11.17
Added high resolution screens support (4K).
Added User Interface (UI) scaling and Font scaling.
Added support of strength identification for Gold.
Added possibility to get notification once N period candle is closed.
Added expression based notification for levels crossing, which allows to get notifications when there is a cross on many different timeframes all at once.
Added averaging CSM values for different timeframe for tradable pairs finder.
Added support for current chart timeframe for all expressions.
Added new Currencies Strength State Notification which shows strength of all currencies as N period candle is closed.
Added averaging CSM values for Currencies Strength State Notification.
Improved history data loading. It allows to show indicator data more faster if history data is missed.
Improved logging at notifications area.
Fixed not sending of notifications on some conditions.
Fixed typo mistakes.
Version 1.20 2020.07.09
Added auto detection of symbols suffix.
Added highlighting of graph lines for current chart instruments.
Added scale ration parameter for RSI algorithm.
Fixed showing of graph lines if selected "Chart Symbols" for "Symbol Type" property.
Version 1.10 2020.05.03
If not enough available bars on current chart or not full history data we start to draw graph lines for available bars rather than wait for downloading of all bars or history data.
Added logging if not possible to calculate currency strength values.
Updating indicator data forcibly if no updates last 30 seconds to avoid old data if there is no any ticks (weekends etc...) for a long time and MT would have downloaded new history data.
Updating indicator data forcibly at indicator init time to init all buffers and construct all necessary objects.
Fixed typo at currency symbol name "NZDUSD".
Fixed problem with program launch when program file name is very long.
Fixed out of range error while navigating through out indicator buffer data if not available bars at current chart.
Fixed smoothing config for Exponential, Smoothed and Linear weighted algorithms.