Abiroid ProfitPercent Arrows Stoch Ichimoku
- Indicators
- Abir Pathak
- Version: 1.7
- Updated: 5 March 2023
- Activations: 20
Abiroid Profit Percent Series 1:
Arrows Indicator Stochastic Ichimoku with ATR
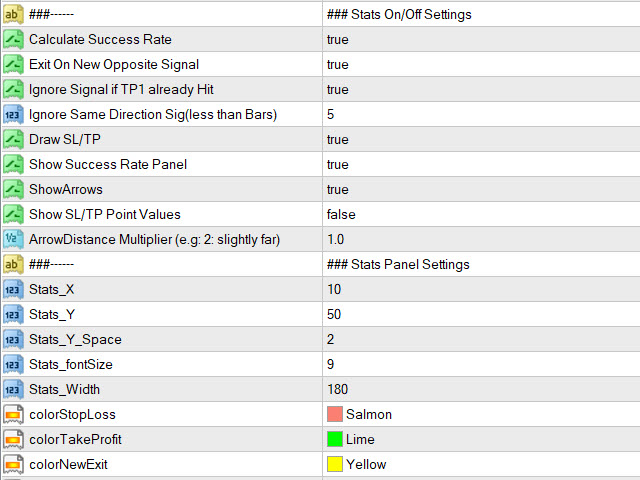
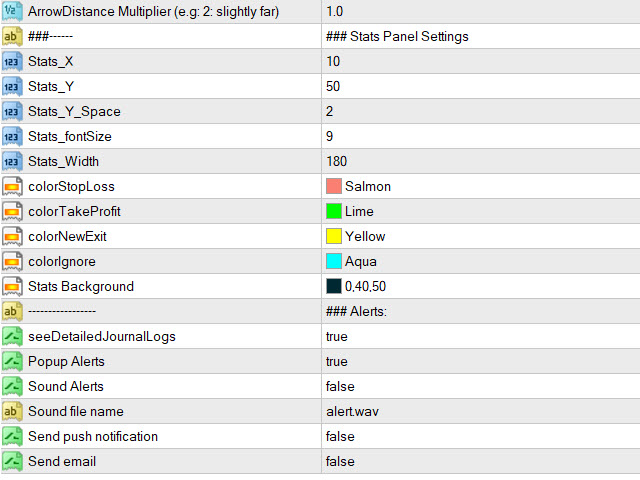
Get the Scanner for free. For getting Profit Percentages for Multiple Timeframes and Multiple Pairs.
And read detailed description about this indicator and all the settings here. And get extra Indicators, Templates and settings for download:
https://abiroid.com/product/profit-percent-stoch-ichimoku-with-atr
Watch the tutorial video here:
About The Strategy:
This strategy has 3 main parts.
Main Signal, Trend Check and SL/TP Prediction:
1. Stochastic/RSI/CCI/Demarker OB/OS (Main Signal)
This allows you to use multiple indicators (comma separated names and settings)
Indicator1: (Main Signal)
For BUY: Oversold crossed and back
For SELL: Overbought crossed and back
Stochastic best Overbought/Sold values: 80/20. DeMarker best OB/OS: 0.7/0.3Indicator 2+ (Validating Indicators – Optional)
Both BUY and SELL Signals will check if Indicator 2 and more are inside safe OverBought/Oversold range.
Once a successful signal is generated, it will check the trend. All Trend checks are optional.
2. Ichimoku or EMA Higher TF (Trend Check Optional)
Use Ichimoku:
Possible Checks (all optional):
For BUY:
Price above Kumo Cloud (at least Min Distance away Points)
Tenkan above Kijun (Min Distance)
Chikou Span away and above Kumo Cloud (Min Distance)
Chikou Span away and above Price (Min Distance)
For SELL, same settings only vice-versa
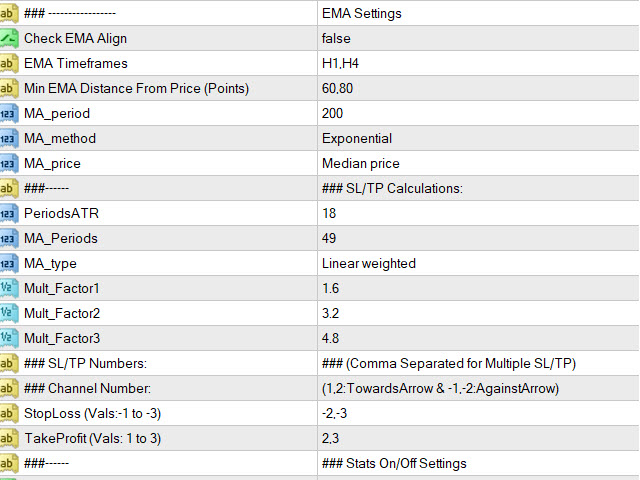
Use EMA for Higher Timeframes (also Optional):
You can specify number of Higher Timeframes for which you need to check EMA Trend for.
If you are trading on M30 and you keep Check EMA HTF number to “3”
Then it will check trend for current timeframe M30 and 2 higher timeframes H1,H4.
If it sees all trends aligned then it will allow the BUY/SELL Signal.
3. ATR (SL/TP Prediction)
The Take Profit and Stop Loss are predicted using ATR Channels. There are 6 channels available.
You can specify how which channel is for TP and SL.
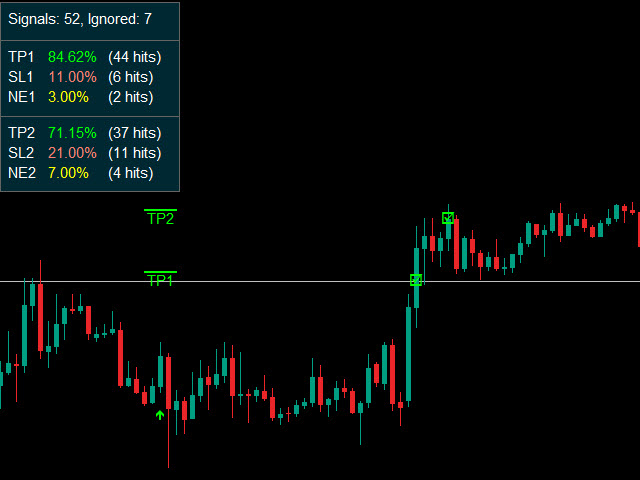
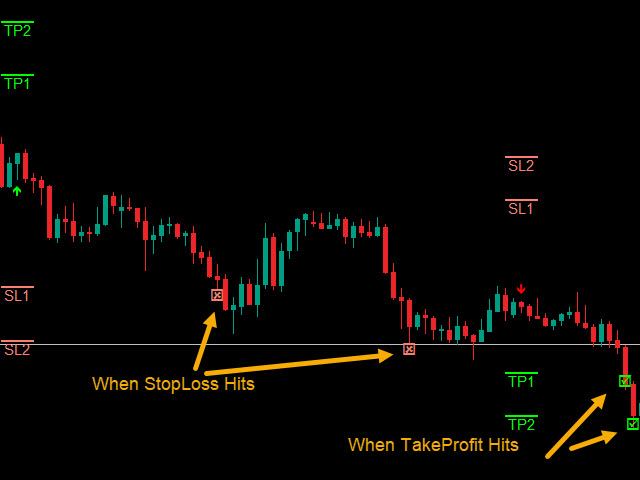
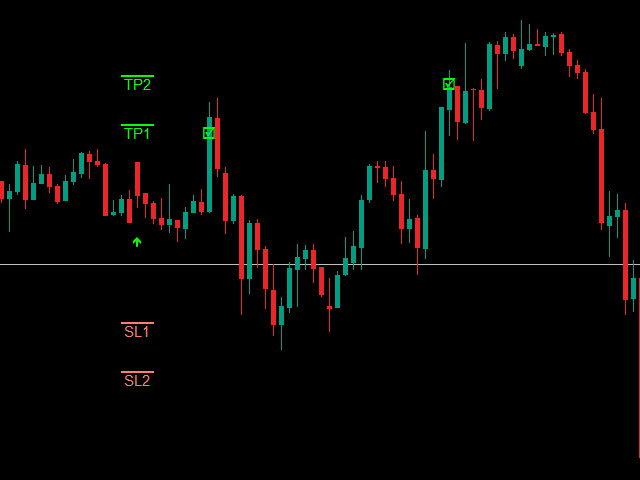
Suppose you are using TP1,TP2,TP3 and SL1,SL2,SL3 as shown in image:
It will compare past bars and check if TP1 was hit or SL1. TP2 is compared with SL2 and so on.
Indicator will show you a percent of successful TP1, 2 or 3 Profits. Or unsuccessful hits and losses with SL Percentage.

