Bermaui RSI Candles
- Indicators
- Muhammad Elbermawi
- Version: 1.0
- Activations: 20
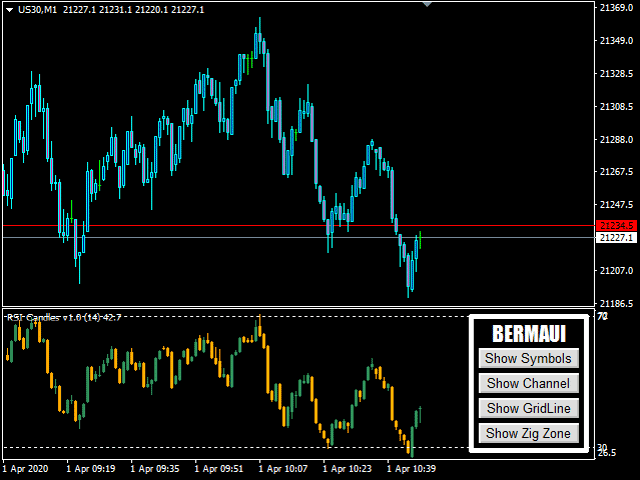
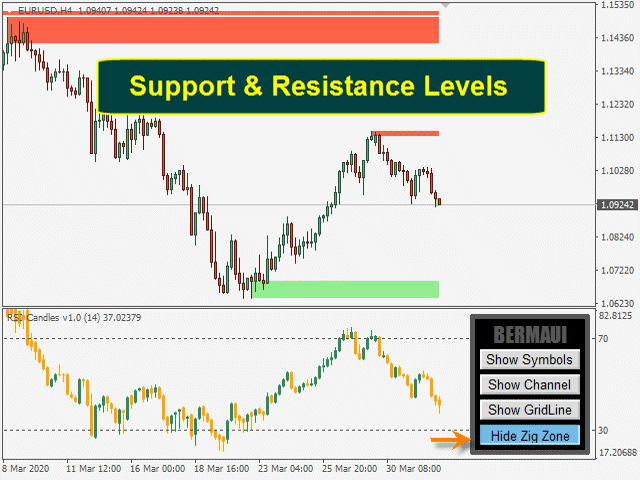
The idea of this indicator is to draw RSI in the form of candles that can be compared with price charts to generate buy and sell signals. The indicator is not my invention. I founded it on the internet several years ago. I updated the code, added alert functions, added the Bermaui Utilities group of tools.
The indicator calculates the RSI of all the prices that are used to draw candlesticks (RSI of the open, high, low & close). It uses the highest of them to draw the RSI candles high wick & the lowest of them to draw the RSI candles low wick. The RSI candles' body lies between their highs and the lows. If the RSI of the open is lower than the RSI of the close, the RSI Candle is considered bullish. If the RSI of the open is higher than the RSI of the close, the RSI Candle is considered bearish.
How to use it
- You can trade trend lines breakout on the RSI Candles indicator, which will lead the trend on the price chart because momentum leads the price.
- You can draw any form of classic chart patterns on the RSI Candles indicator and trade them exactly like how you do with the original RSI.
- It can be used as a classic RSI. If it crosses overbought (70%), then sell and if it crosses oversold (30%), then buy.
- You can use divergence between RSI Candles and price charts to confirm your trading signals.
RSI Candles Features
- It does not repaint or recalculate its results.
- It works on cryptocurrencies, stock, index, oil, gold, and on all time frames.
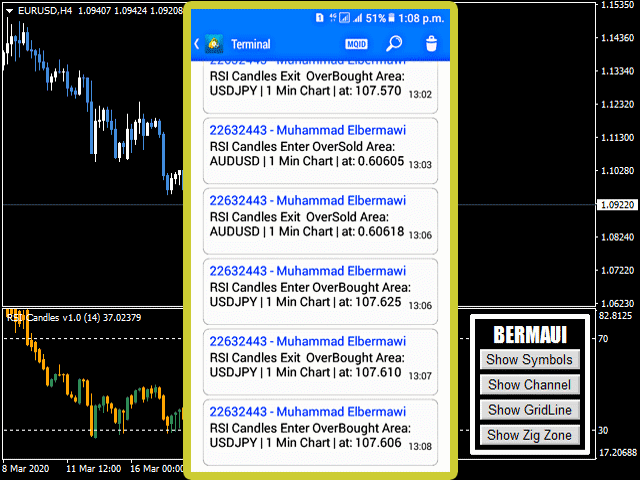
- Sound, email alerts and Mobile Notification.
- Vertical Lines that show overbought and oversold signals on the chart.
- Well-designed parameters to help user easily navigate between them.
- Buffer to build your own expert advisors.
- Four different color lists to choose from.
RSI Candles Parameters
(1) INDICATOR PARAMETERS
- RSI Period.The default is 14.
- Over Sold Level.The default is 30%
- Over Bought Level.The default is 70%
(2) V LINES & ALERTS
- Show Vertical Line.If true it will draw vertical lines on the chart when RSI Candles cross to/out of the overbought or oversold areas. The default is false.
- Sound Alert.The default is true.
- Send Email.The default is false.
- Send Mobile Notification.The default is false.
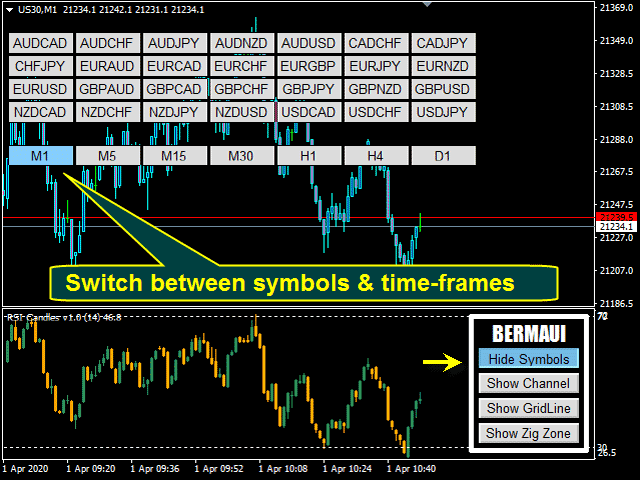
- Symbols Source from.Get symbols from the custom Symbol Listor from Market Watch.
- List of symbols (separated by ";")If you choose symbols from a custom list then separate between symbols by ";".
- Button Font Size. The default is ten.
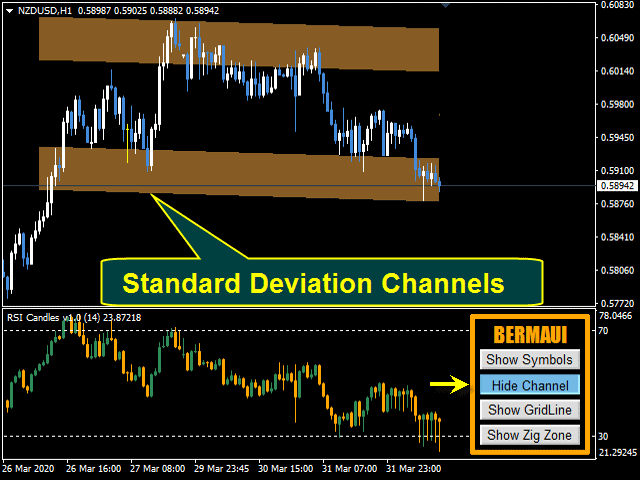
- Channel Length [> 1]Number of candles used in channel calculation. The default is 100.
- Panel Appear [Shift + Letter]Letter to press plus shift to make the panel appear. Default is "A"
- Panel Disappear [Shift + Letter]Letter to press plus shift to make the panel disappear. Default is "D"
- Chart Colors List:the user can choose between four different color lists for his chart or he can choose (Do Nothing) if he wants to use his own list.
Muhammad Al Bermaui, CMT








This is the best RSI indicator. HIghly recommnended. Please kindly send me the free Stochastic indicator. Thank you.