• Overview
  • Reviews
  • Comments
  • What's new

Currency Sessions Highlight Ind

Contact us for any custom order, CodeYourTrade.com.

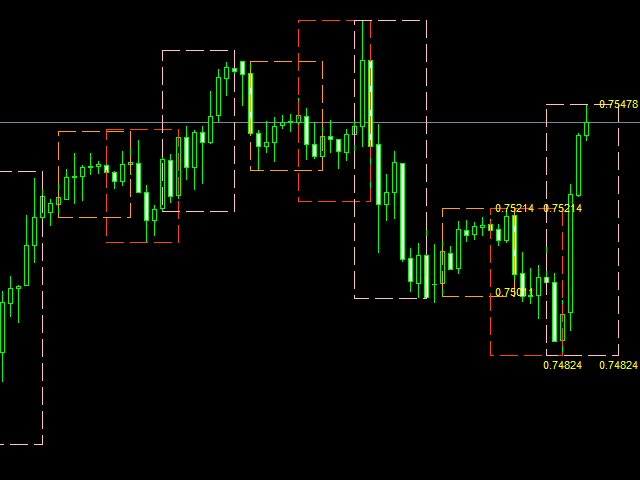
Currency Sessions Highlight indicator is used to highlight the sessions. The maximum number of sessions visible at a time is 3. A user has to input the input the start and end time of the session in the format HH:MM.

You can hide all the information displayed in the chart by setting false to Show On Chart.
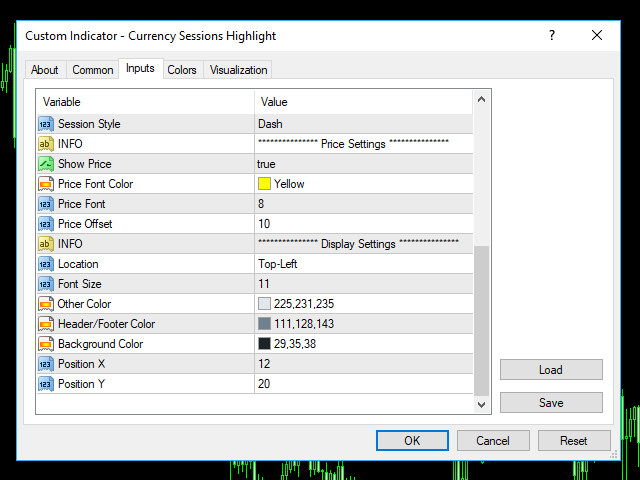
Indicator Settings:

Main Setting

  • Show Session 1: Draw Session 1 on chart or not
  • Session 1 Start: Start time of the session 1
  • Session 1 End: End time of the session 1
  • Session 1 Color: Color of the Session 1
  • Show Session 2: Draw Session 2 on chart or not
  • Session 2 Start: Start time of the session 2
  • Session 2 End: End time of the session 2
  • Session 2 Color: Color of the Session 2
  • Show Session 3: Draw Session 3 on chart or not
  • Session 3 Start: Start time of the session 3
  • Session 3 End: End time of the session 3
  • Session 3 Color: Color of the Session 3
  • Session Style: Style of the session rectangle line
    • Solid
    • Dash
    • Dot
    • DashDot
    • HashDotDot

Price Setting

  • Show Price: Show the high/low price of the session
  • Price Font Color: Color of the price
  • Price Font: Font size of the price
  • Price Offset: Distance of price from high/low

Recommended products
We present you the indicator "Candle closing counter", which will become your indispensable assistant in the world of trading. That’s why knowing when the candle will close can help: If you like to trade using candle patterns, you will know when the candle will be closed. This indicator will allow you to check if a known pattern has formed and if there is a possibility of trading. The indicator will help you to prepare for market opening and market closure. You can set a timer to create a p
The Bollinger Band is a strategy that has become one of the most useful tools for spotlighting extreme short-term price moves. Bollinger Bands consist of a centerline and two price channels or bands above and below it. The centerline is typically a   simple moving average   while the price channels are the standard deviations of the stock being studied. The bands expand and contract as the   price action   of an issue becomes volatile (expansion) or becomes bound into a tight trading pattern (c
TWO PAIRS SQUARE HEDGE METER INDICATOR Try this brilliant 2 pairs square indicator It draws a square wave of the relation between your two inputs symbols when square wave indicates -1 then it is very great opportunity to SELL pair1 and BUY Pair2 when square wave indicates +1 then it is very great opportunity to BUY pair1 and SELL Pair2 the inputs are : 2 pairs of symbols         then index value : i use 20 for M30 charts ( you can try other values : 40/50 for M15 , : 30 for M30 , : 10 for H1 ,
Daily Candle Predictor is an indicator that predicts the closing price of a candle. The indicator is primarily intended for use on D1 charts. This indicator is suitable for both traditional forex trading and binary options trading. The indicator can be used as a standalone trading system, or it can act as an addition to your existing trading system. This indicator analyzes the current candle, calculating certain strength factors inside the body of the candle itself, as well as the parameters of
Strong Retracement Points Pro demo edition! SRP (Strong Retracement/Reversal Points) is a powerful and unique support and resistance indicator. It displays the closest important levels which we expect the price retracement/reversal! If all level are broken from one side, it recalculates and draws new support and resistance levels, so the levels might be valid for several days depending on the market! If you are still hesitating to start using this wonderful tool, you can check this link to see h
The Vortex Indicator was inspired by the work of an Austrian inventor, Viktor Schauberger, who studied the flow of water in rivers and turbines. Etienne Botes and Douglas Siepman developed the idea that movements and flows within financial markets are similar to the vortex motions found in water. The Vortex Indicator was also partly inspired by J. Welles Wilder's concept of directional movement, which assumes the relationship between price bars gives clues as to the direction of a market. This i
Blahtech Market Profile
Blahtech Limited
4.61 (18)
Was: $249  Now: $99   Market Profile defines a number of day types that can help the trader to determine market behaviour. A key feature is the Value Area, representing the range of price action where 70% of trading took place. Understanding the Value Area can give traders valuable insight into market direction and establish the higher odds trade. It is an excellent addition to any system you may be using. Blahtech Limited presents their Market Profile indicator for the MetaTrader community. Ins
Royal Dutch Skunk
Sayan Vandenhout
ROYAL DUTCH SKUNK USES THE TREND WAVE INDICATOR AND IT CAN IDENTIFY THE BEGINNING AND THE END OF A NEW WAVE TREND MOVEMENT. AS AN OSCILLATOR, THE INDICATOR IDENTIFIES THE OVERBOUGHT AND OVERSOLD ZONES. IT WORKS GREAT TO CATCH THE SHORT TERM PRICE REVERSALS AND USES A MARTINGALE STRATEGY TO CLOSE ALL TRADES IN PROFIT. USE DEFAULT SETTINGS ON H1 OR HIGHER TIME FRAME ON ANY PAIR FOR MORE ACCURATE TRADES WHY THIS EA : Smart entries calculated by 6 great strategies The EA can be run on even a $20000
Master Scalping M1 is an innovative indicator that uses an algorithm to quickly and accurately determine the trend.The indicator calculates the time of opening and closing positions, the indicator's algorithms allow you to find the ideal moments to enter a deal (buy or sell an asset), which increase the success of transactions for most traders. Benefits of the indicator: Easy to assemble, does not overload the chart with unnecessary information. Can be used as a filter for any strategy. Works on
Forex Gump
Andrey Kozak
2.83 (6)
Forex Gump is a fully finished semi-automatic trading system. In the form of arrows, signals are displayed on the screen for opening and closing deals. All you need is to follow the instructions of the indicator. When the indicator shows a blue arrow, you need to open a buy order. When the indicator shows a red arrow, you need to open a sell order. Close orders when the indicator draws a yellow cross. In order to get the most effective result, we recommend using the timeframes H1, H4, D1. There
Awesome Oscillator by Bill Williams with the ability to fine-tune and replace the averaging algorithms of the indicator, which significantly expands the possibilities of using this oscillator in algorithmic trading and brings it closer in its properties to such an indicator as the MACD. To reduce price noise, the final indicator is processed with an additional Smooth averaging. The indicator has the ability to give alerts, send mail messages and push signals when the direction of movement of th
GND Tail Candle
Nguyen Dang Giang
A tall upper shadow occurs when the price moves during the period, but goes back down, which is a bearish signal. A tall lower shadow forms when bears push the price down, but bulls pull it back up, which leaves a long line or shadow. This is considered a bullish signal. Some technical analysts believe a tall or long shadow means the stock will turn or reverse. Some believe a short or lower shadow means a price rise is coming. In other words, a tall upper shadow means a downturn is coming, whil
This is a new strategy for SUPPLY DEMAND areas It is based on a calculation using the tick volume to detect the big price action in market for both bear /bull actions this smart volume action candles are used to determine the supply and demand areas prices in between main supply and demand lines indicate sideway market  up arrows will be shown when prices moves above the main supply and the secondary supply lines Down arrows will be shown when prices moves below the main demand and the secondary
KT Renko Patterns MT4
KEENBASE SOFTWARE SOLUTIONS
2.33 (3)
KT Renko Patterns scans the Renko chart brick by brick to find some famous chart patterns that are frequently used by traders across the various financial markets. Compared to the time-based charts, patterns based trading is easier and more evident on Renko charts due to their uncluttered appearance. KT Renko Patterns features multiple Renko patterns, and many of these patterns are extensively explained in the book titled Profitable Trading with Renko Charts by Prashant Shah. A 100% automate
The indicator builds current quotes, which can be compared with historical ones and on this basis make a price movement forecast. The indicator has a text field for quick navigation to the desired date. Options: Symbol - selection of the symbol that the indicator will display; SymbolPeriod - selection of the period from which the indicator will take data; IndicatorColor - indicator color; Inverse - true reverses quotes, false - original view; Next are the settings of the te
The new update makes this indicator a complete tool for studying, analyzing and operating probabilistic patterns. It includes: On-chart Multi-asset percentage monitor. Configurable martingales. Twenty-one pre-configured patterns , including Mhi patterns and C3. An advanced pattern editor to store up to 5 custom patterns. Backtest mode to test results with loss reports. Trend filter. Hit operational filter. Martingale Cycles option. Various types of strategies and alerts. Confluence between patte
Title : Market Bias Indicator - Oscillator-Based Trading Tool Introduction : Discover the potential of the "Market Bias Indicator," a revolutionary oscillator-based trading tool designed for precise market analysis. If you're in search of a robust alternative to traditional bias indicators, your quest ends here. Market Bias Indicator offers unparalleled accuracy in identifying market sentiment and is your gateway to confident trading decisions. Recommended Trading Pairs : Market Bias Indicator i
Trend and Fibo Mr Beast
Luis Mariano Vazquez Marcos
Indicador Trend and Fibonacci ProTrader Mr Beast  El Indicador Fibonacci ProTrader v1.0 es una potente herramienta diseñada para optimizar tus estrategias de trading en MetaTrader, aprovechando la precisión y la lógica de la secuencia de Fibonacci. Este indicador incorpora señales avanzadas de take profit, tendencia take profit y stop loss, proporcionando una guía estratégica sólida para tus operaciones. Características Principales: Secuencia de Fibonacci Dinámica: El indicador traza automátic
Trend Ray
Andriy Sydoruk
The indicator shows the potential trend direction by cyclical-wave dependence. Thus, all the rays of the intersection will be optimal rays, in the direction of which the price is expected to move, taking into account the indicator period. Rays can be used as a direction for potential market movement. But we must not forget that the approach must be comprehensive, the indicator signals require additional information to enter the market.
The   VWAP indicator   is our version of the popular Volume-Weighted Average Price indicator. The VWAP is the ratio between the value traded (price multiplied by the number of volume traded) and the total volume traded over a specific time period. As a result, it measures the average price of the instrument much better than the simple moving average. Although there are many ways to use the VWAP, most investors use it to calculate the daily average.  The indicator works in five modes: Moving  
KT Double Top Bottom MT4
KEENBASE SOFTWARE SOLUTIONS
The double top bottom pattern is arguably one of the technical analysis's most popular chart patterns. These patterns are used to capitalize on recurring patterns and identify trend reversal patterns, thereby creating well-placed entry and exit levels. The KT Double Top Bottom is based on these patterns and fine-tunes the trade signal development process for traders. Features It's based on one of the most reliable trading patterns and brings some fine-tuning and automation to the process. A
MACDivergence MTF
Pavel Zamoshnikov
4.29 (7)
Advanced ideas of the popular MACD indicator: It detects and displays classic and reverse divergences (three methods of detecting divergences). It uses different color to highlight an uptrend and a downtrend. Two methods of determining a trend: а) MACD crosses the 0 level (classic signal); б) MACD crosses its own average (early signal). This is a multi-timeframe indicator: it can display MACD data from other timeframes. Two methods of drawing: classic histogram and line. It generates sound and v
Currency StrengtT
Hafis Mohamed Yacine
What Is Currency StrengtT Indicator? A currency strengthT indicator is a graphical tool that shows the strength of a currency. Common indicators usually show the strength of a currency in relation to another currency, however, with some calculations it is possible to find the absolute strength of each individual currency. Therefore, a currency strength matrix indicator (or meter) is a tool that tries to express the absolute strength of a currency, so that you can compare this strength with
EA Black Box
Vitali Vasilenka
EA Black Box       Expert Advisor is already ahead of its time!    - a trading algorithm that includes key Harmonic Patterns  Has Harmonic Patterns: Bullish_5-0_Pattern Bearish_5-0_Pattern Bearish_Three_Drives Bullish_Three_Drives Telegram channel of our community -   https://t.me/EAQuantumLab Official community site -   https://eaquantumlab.com Real signals are available here:   https://www.mql5.com/en/users/vitalvasa/seller Minimum deposit for trading 1000$ Use accounts with a minimum
Our Basic Support and Resistance indicator is the solution you need to boost your technical analysis. This indicator allows you to project support and resistance levels on the chart / MT5 Version Features Integration of Fibonacci Levels:  With the option to display Fibonacci levels alongside support and resistance levels, our indicator gives you an even deeper insight into market behavior and possible reversal areas. Performance Optimization:  With the option to update extended lines only at
PZ Trend Trading
PZ TRADING SLU
4.8 (5)
Trend Trading is an indicator designed to profit as much as possible from trends taking place in the market, by timing pullbacks and breakouts. It finds trading opportunities by analyzing what the price is doing during established trends. [ Installation Guide | Update Guide | Troubleshooting | FAQ | All Products ] Trade financial markets with confidence and efficiency Profit from established trends without getting whipsawed Recognize profitable pullbacks, breakouts and early reversals The ind
Scalping Arrow Notification Phone is a unique scalping trading indicator. The indicator draws arrows on the chart when you need to open an order, shows in which direction you need to open orders, and also sends you a notification about a signal to your mobile phone. At any time, even when you are not at the computer, you will receive signals, be able to control the market and trade. The indicator shows with an arrow when to open an order, as well as the direction of the arrow shows in which dir
Time Bubble ***Specialized for GBPJPY 1H time frame*** (tested for two years with success rates about 82%) Time Circle's smart algorithm detects the price circles with time . give strong signals at the right time as result of combine the price and time. our team spent months to develop this indicator specially for GBPJPY ..with high success rates about 82% win trades over two years .tested from December 2016 to November 2018. *** in last two years total signals 1012 with 829 Wins and
This product is a part of  ON Trade Waves Patterns Harmonic Elliot Wolfe you can test free version on EURJPY from this link  Wolf Waves Indicator Discover Wolf Waves - Your Ultimate Trading Tool! Are you on the hunt for a powerful tool to spot Wolf Waves easily on any time frame? Look no further! Our Wolf Waves indicator does the job effortlessly. Here's why it's perfect for you: Key Features: Automatic Detection: Our Wolf Waves indicator finds key points and draws lines on your chart automa
Fibonacci retracement and extension line drawing tool Fibonacci retracement and extended line drawing tool for MT4 platform is suitable for traders who use  golden section trading Advantages: There is no extra line, no too long line, and it is easy to observe and find trading opportunities Trial version: https://www.mql5.com/zh/market/product/35884 Main functions: 1. Multiple groups of Fibonacci turns can be drawn directly, and the relationship between important turning points
Buyers of this product also purchase
Gann Made Easy
Oleg Rodin
4.93 (87)
Gann Made Easy is a professional and easy to use Forex trading system which is based on the best principles of trading using the theory of mr. W.D. Gann. The indicator provides accurate BUY and SELL signals including Stop Loss and Take Profit Levels. You can trade even on the go using PUSH notifications. PLEASE CONTACT ME AFTER PURCHASE TO GET MY TRADING TIPS PLUS A GREAT BONUS! Probably you heard already many times about Gann trading methods. Usually Gann's theory is very complex thing not only
Gold Stuff
Vasiliy Strukov
4.89 (263)
Gold Stuff is a trend indicator designed specifically for gold and can also be used on any financial instrument. The indicator does not redraw and does not lag. Recommended time frame H1. At it indicator work full auto  Expert Advisor EA Gold Stuff. You can find it at my profile. Contact me immediately after the purchase to get   personal bonus!  You can get a free copy of our Strong Support and Trend Scanner indicator, please pm. me! Settings  and manual here   SETTINGS Draw Arrow - on off. dra
Scalper Inside PRO
Alexey Minkov
4.75 (59)
An exclusive indicator that utilizes an innovative algorithm to swiftly and accurately determine the market trend. The indicator automatically calculates opening, closing, and profit levels, providing detailed trading statistics. With these features, you can choose the most appropriate trading instrument for the current market conditions. Additionally, you can easily integrate your own arrow indicators into Scalper Inside Pro to quickly evaluate their statistics and profitability. Scalper Inside
Currently 20% OFF ! Best Solution for any Newbie or Expert Trader! This dashboard software is working on 28 currency pairs plus one. It is based on 2 of our main indicators (Advanced Currency Strength 28 and Advanced Currency Impulse). It gives a great overview of the entire Forex market plus Gold or 1 indices. It shows Advanced Currency Strength values, currency speed of movement and signals for 28 Forex pairs in all (9) timeframes. Imagine how your trading will improve when you can watch the e
TPSpro RFI Levels
Roman Podpora
4.86 (21)
Reversal First Impulse levels (RFI)    INSTRUCTIONS        RUS       -       ENG              R ecommended to use with an indicator   -   TPSpro  TREND PRO -  Version MT5 A key element in trading is zones or levels from which decisions to buy or sell a trading instrument are made. Despite attempts by major players to conceal their presence in the market, they inevitably leave traces. Our task was to learn how to identify these traces and interpret them correctly. Main functions: Displaying activ
AT Forex Indicator MT4
Marzena Maria Szmit
5 (2)
The AT Forex Indicator MT4 is a sophisticated trading tool designed to provide traders with a comprehensive analysis of multiple currency pairs. This   powerful indicator   simplifies the complex nature of the forex market, making it accessible for both novice and experienced traders. AT Forex Indicator uses   advanced algorithms   to detect trends, patterns and is an essential tool for traders aiming to enhance their forex trading performance. With its robust features, ease of use, and reliabl
TPSproTREND PrO
Roman Podpora
4.78 (18)
TPSpro TRENDPRO  - is a trend indicator that automatically analyzes the market and provides information about the trend and each of its changes, as well as giving signals for entering trades without redrawing! The indicator uses each candle, analyzing them separately. referring to different impulses - up or down impulse. Exact entry points into transactions for currencies, crypto, metals, stocks, indices!  -  Version MT5               DETAILED DESCRIPTION                R ecommended to use with
First of all Its worth emphasizing here that this Trading Tool is Non-Repainting Non-Redrawing and Non-Lagging Indicator Which makes it ideal for professional trading . Online course, user manual and demo. The Smart Price Action Concepts Indicator is a very powerful tool for both new and experienced traders . It packs more than 20 useful indicators into one combining advanced trading ideas like Inner Circle Trader Analysis and Smart Money Concepts Trading Strategies . This indicator focuses on
FX Power MT4 NG
Daniel Stein
5 (11)
Trading GOLD, and currencies, with the dog walk strategy  - super smart Trading GOLD, and currencies, with the breakout strategy  - super easy Visit our all-new   Stein Investments Welcome Page   to get the latest information, updates and trading strategies. FX Power MT4 NG  is the next generation of our long-time very popular currency strength meter, FX Power.  And what does this next-generation strength meter offer? Everything you have loved about the original FX Power  PLUS GOLD/XAU stre
Trend Screener
STE S.S.COMPANY
4.83 (90)
Unlock the Power of  Trends trading with Trend Screener Indicator: Your Ultimate Trend Trading Solution powered by fuzzy logic and Multi-currencies System ! Elevate your trend trading with Trend Screener, the revolutionary trend indicator powered by   fuzzy logic.  It is a powerful trend-following indicator that combines over  13 premium tools and features and 3 trading strategies  , making it a versatile choice to   make your Metatrader a Trend Analyzer. LIMITED TIME OFFER : Trend Screener Indi
Currency Strength Wizard is a very powerful indicator that provides you with all-in-one solution for successful trading. The indicator calculates the power of this or that forex pair using the data of all currencies on multiple time frames. This data is represented in a form of easy to use currency index and currency power lines which you can use to see the power of this or that currency. All you need is attach the indicator to the chart you want to trade and the indicator will show you real str
M1 Arrow
Oleg Rodin
5 (14)
M1 Arrow is an indicator which is based on natural trading principles of the market which include volatility and volume analysis. The indicator can be used with any time frame and forex pair. One easy to use parameter in the indicator will allow you to adapt the signals to any forex pair and time frame you want to trade. The Arrows DO NOT REPAINT and DO NOT LAG! The algorithm is based on the analysis of volumes and price waves using additional filters. The intelligent algorithm of the indicato
Indicator : RealValueIndicator Description : RealValueIndicator is a powerful tool designed specifically for trading on the EURUSD pair. This indicator analyzes all EUR and USD pairs, calculates their real currency strength values, and displays them as a single realistic value to give you a head start on price. This indicator will tell you moves before they happen if you use it right. RealValueIndicator allows you to get a quick and accurate overview of the EURUSD currency pair tops and bottoms,
Trend Punch
Mohamed Hassan
5 (16)
Manual guide:   Click here WEEK SALE PROMO:   $59 ONLY!  -- Next price is  $120 .  This indicator is unstoppable when combined with our other indicator called  Support & Resistance . After purchase, send us a message and you will get it   for  FREE as a BONUS! I like to use Trend Punch on XAUUSD on the M1 timeframe & higher ones!  Introducing Trend Punch , the revolutionary forex trend indicator that will transform the way you trade! Trend Punch is uniquely designed to provide pre
Atomic Analyst
Issam Kassas
5 (3)
First of all Its worth emphasizing here that this Trading Indicator is   Non-Repainting , Non Redrawing and Non Lagging Indicator   Indicator, Which makes it ideal from both manual and robot trading.  User manual: settings, inputs and strategy . The Atomic Analyst  is a PA Price Action Indicator that uses Strength and Momentum of the price to find a better edge in the market. Equipped with Advanced filters which help remove noises and false signals, and Increase Trading Potential. Using Multipl
CURRENTLY 26% OFF Best Solution for any Newbie or Expert Trader! This Indicator is a unique, high quality and affordable trading tool because we have incorporated a number of proprietary features and a new formula. With only ONE chart you can read Currency Strength for 28 Forex pairs! Imagine how your trading will improve because you are able to pinpoint the exact trigger point of a new trend or scalping opportunity? User manual: click here That's the first one, the original! Don't buy a worthle
Introducing   Quantum Trend Sniper Indicator , the groundbreaking MQL5 Indicator that's transforming the way you identify and trade trend reversals! Developed by a team of experienced traders with trading experience of over 13 years,   Quantum Trend Sniper Indicator   is designed to propel your trading journey to new heights with its innovative way of identifying trend reversals with extremely high accuracy. ***Buy Quantum Trend Sniper Indicator and you could get Quantum Breakout Indicator fo
Advanced Supply Demand
Bernhard Schweigert
4.92 (313)
CURRENTLY 26% OFF !! Best Solution for any Newbie or Expert Trader! This indicator is a unique, high quality and affordable trading tool because we have incorporated a number of proprietary features and a new formula. With this update, you will be able to show double timeframe zones. You will not only be able to show a higher TF but to show both, the chart TF, PLUS the higher TF: SHOWING NESTED ZONES. All Supply Demand traders will love it. :) Important Information Revealed Maximize the potenti
TrendMaestro
Stefano Frisetti
5 (3)
note: this indicator is for METATRADER4, if you want the version for METATRADER5 this is the link:  https://www.mql5.com/it/market/product/108106 TRENDMAESTRO ver 2.4 TRENDMAESTRO recognizes a new TREND in the bud, he never makes mistakes. The certainty of identifying a new TREND is priceless. DESCRIPTION TRENDMAESTRO identifies a new TREND in the bud, this indicator examines the volatility, volumes and momentum to identify the moment in which there is an explosion of one or more of these data a
JULY OFFER 80% OFF next price for unlimited version will be 17000$. This is the only time you can get this institutional and professional indicator at this price for unlimited version. Don't dare to miss this. The tool I am about to introduce to you you can't compare it with other tools due to its strategy and accuracy level in predicting the next price directional movement . This tool is designed for serious traders who have decided to make a difference through trading. Be the next person to wi
Quantum Breakout Indicator PRO
Bogdan Ion Puscasu
4.96 (26)
Introducing   Quantum Breakout PRO , the groundbreaking MQL5 Indicator that's transforming the way you trade Breakout Zones! Developed by a team of experienced traders with trading experience of over 13 years, Quantum Breakout PRO is designed to propel your trading journey to new heights with its innovative and dynamic breakout zone strategy. Quantum Breakout Indicator will give you signal arrows on breakout zones with 5 profit target zones and stop loss suggestion based on the breakout box.
Enigmera
Ivan Stefanov
5 (4)
ENIGMERA: The core of the market (If the demo of mql5.com doesn't working and you want to try Enigmera please message me.) Introduction This indicator and trading system is a remarkable approach to the financial markets . ENIGMERA uses the fractal cycles to accurately calculate support and resistance levels. It shows the authentic accumulation phase and gives direction and targets.  A system that works whether we are in a trend or a correction.   How does it operate? ENIGMERA comprises of fol
The ADR Reversal Indicator shows you at a glance where price is currently trading in relation to it's normal average daily range. You will get instant alerts via pop-up, email or push when price exceeds it's average range and levels above it of your choosing so you can jump into pullbacks and reversals quickly. The indicator draws horizontal lines on the chart at the average daily range extremes and also extensions above those levels which have mathematical probabilities attached to them of pric
Cycle Sniper
Elmira Memish
4.41 (37)
NEW YEAR SALE PRICE FOR LIMITED TIME!!! Please contact us after your purchase and we will send you the complimentary indicators to complete the system Cycle Sniper is not a holy grail but when you use it in a system which is explained in the videos, you will feel the difference. If you are not willing to focus on the charts designed with Cycle Sniper and other free tools we provide, we recommend not buying this indicator. We recommend watching the videos about the indiactor and system before pu
TrendDecoder Premium
Christophe Pa Trouillas
5 (6)
Identify ranges  | Get earliest signals of Trends  | Get clear exits before reversal  | Spot the Fibo levels the price will test Non-repainting, non-delayed indicator - ideal for manual and automated trading - for all assets and all time units $69   for launch - then back to >>   $149 After purchase,   please contact me on this channel   for recommended and personalised settings MT5   version:  Click here Get our full method with  BladeSCALPER  and   PowerZONES What is it about? TrendDECOD
Trend Line Map Pro
STE S.S.COMPANY
4.73 (15)
Trend Line Map indicator is an addons for Trend Screener Indicator . It's working as a scanner for all signals generated by Trend screener ( Trend Line Signals ) . It's a Trend Line Scanner based on Trend Screener Indicator.  If you don't have Trend Screener Pro Indicator, the Trend Line Map Pro will not work. LIMITED TIME OFFER : Trend Line Map Indicator is available for only 50 $ and lifetime. ( Original price 125$ ) By accessing to our MQL5 Blog,  you can find all our premium indicators w
Advanced Currency IMPULSE with ALERT
Bernhard Schweigert
4.91 (495)
CURRENTLY 31% OFF !! Best Solution for any Newbie or Expert Trader! This indicator is a unique, high quality and affordable trading tool because we have incorporated a number of proprietary features and a secret formula. With only ONE chart it gives Alerts for all 28 currency pairs. Imagine how your trading will improve because you are able to pinpoint the exact trigger point of a new trend or scalping opportunity! Built on new underlying algorithms it makes it even easier to identify and confir
FX Volume
Daniel Stein
4.61 (36)
Visit our all-new   Stein Investments Welcome Page   to get the latest information, updates and trading strategies. FX Volume is the FIRST and ONLY volume indicator that provides a REAL insight into the market sentiment from a broker's point of view. It provides awesome insights into how institutional market participants, like brokers, are positioned in the Forex market, much faster than COT reports. Seeing this information directly on your chart is the real game-changer and breakthrough solut
TakePropips Donchian Trend Pro
Eric John Pajarillaga Aldana
4.61 (18)
TakePropips Donchian Trend Pro  (MT4) is a powerful and effective tool that automatically detects the direction of the trend using the Donchian Channel and provides you with an entry and exit trading signals! This multi-function indicator includes a trend scanner, trading signals, statistical panel, screener, trading sessions, and alerts history dashboard. It is designed to provide you with trading signals and save you hours analyzing the charts! You can download the user manual and installation
ICT, SMC, SMART MONEY CONCEPTS, SMART MONEY, Smart Money Concept, Support and Resistance, Trend Analysis, Price Action, Market Structure, Order Blocks, BOS/CHoCH,   Breaker Blocks ,  Momentum Shift, Supply&Demand Zone/Order Blocks , Strong Imbalance, HH/LL/HL/LH,    Fair Value Gap, FVG,  Premium  &   Discount   Zones, Fibonacci Retracement, OTE, Buy Side Liquidity, Sell Side Liquidity, BSL/SSL Taken, Equal Highs & Lows, MTF Dashboard, Multiple Time Frame, BigBar, HTF OB, HTF Market Structure,  L
More from author
Contact us for any custom order,   CodeYourTrade.com . Channel Breakout indicator shows the channels based on the number of bars. It is used to trades the breakouts or reversals. Breakout is quite efficient, since it tries making profit when the market crashes!! You can also invent your own technique out of it. After you attach the indicator to a chart it will show the following information on the chart: 1.     Channel 1 and channel 2 information 2.     Alert and email information   You can hid
Contact us for any custom order,   CodeYourTrade.com . Candle Close Time indicator is used to track the time remaining or passed on a current candle at any point of time. To get notified set the time in format DD:HH:MM:SS. For example : EnableNotify = true & (Day Left : Hour Left : Minute Left : Second Left) = 00:02:20:20. Let’s say remaining time to close candle is 00:03:23:21 (DD:HH:MM:SS). Now, when the time remaining reaches below 00:02:20:20, it shows an Alert box. You can hide all the in
Continuous Bars indicator is used to track the continuous bars closed in one direction. For example : Continuous Bars = 3 (we are looking for 3 continuous bars) Now, if (Open > Close) or (Close > Open) for 3 continuous bars it is notified via email or alert. You can hide all the information displayed in the chart by setting  false  to  Show On Chart . Indicator Settings: Main Setting Bars : Number of continuous bars we are looking Price Setting Use M1 Timeframe: Look for continuous bars in M1 ti
This indicator provides the technical overview using following tools: Pivot Points Technical Indicators Moving Averages Pivot Points are calculated using five different methods: Classic Fibonacci Camarilla Woodie DeMark With the technical indicator , you can find the trading signals using the combination of different indicators. It supports the following technical indicators: RSI Stochastic Stochastic RSI MACD ADX CCI ATR Ultimate Oscillator ROC Bull/Bear Power Moving Averages is used to find th
Contact us for any custom order,   CodeYourTrade.com . Keltner Channels are volatility-based envelopes. Moving average dictates direction and the ATR sets the channel width. It’s a trend following indicator used to identify reversals. Channels can also be used to identify overbought and oversold levels when the trend is flat. Trading Strategy We have created 2 zones SELL ZONE and BUY ZONE using the Keltner channels. In SELL ZONE (upper) we take only sell orders and in BUY ZONE (lower) we take
Contact us for any custom order,   CodeYourTrade.com . The MACD Histogram measures the distance between the MACD line and the MACD signal line. Two important terms are derived from the MACD histogram are: ·          Convergence : The MACD histogram is shrinking in height. This occurs because there is a change in direction or a slowdown in the trend. When that occurs, the MACD line is getting closer to the MACD signal line. ·          Divergence : The MACD histogram is increasing in height (eit
Contact us for any custom order,   CodeYourTrade.com . Multiple Moving Average (MA) indicator is used to find the direction of the trend using multiple Moving Average indicators. It calculates using the following rules: ·          Ask < MA, it is SELL ·          Bid > MA, it is BUY ·          Ask > MA > Bid, it is None (no signal) After you attached the indicator to a chart it will show the following information on the chart: Multiple MAs arranged by their method Buy and Sell count Summary: Co
Contact us for any custom order,   CodeYourTrade.com . This indicator is used to calculate the pivot points using 5 different methods: Classic Fibonacci Camarilla Woodie DeMark After you attached the indicator to a chart it will show the following information on the chart: Pivot points levels of the current chart using different methods. Indicator Setting Pivot Point Calculator Show Pivot Point Calculator: Show all pivot points on chart Pivot Points Timeframe: It tells which time is used to ca
Contact us for any custom order,   CodeYourTrade.com . The Stochastic RSI indicator is essentially an indicator of an indicator. It is used in technical analysis to provide a stochastic calculation to the RSI indicator. This means that it is a measure of RSI relative to its own high/low range over a user-defined period of time. This indicator is primarily used for identifying overbought and oversold conditions. You can hide all the information displayed in the chart by setting  false  to  Sho
Spread & Swap Indicator is used to check the spread and swap for the current pair. You can hide all the information displayed in the chart by setting  false  to  Show On Chart . Indicator Settings: Main Setting Display Spread : Shows the spread of the current pair. Display Swap (per lot) : Show the swap charges per lot for the current pair. Display Setting Display : Shows the indicator information on chart Location : Location of the display window Top-Left : Display all the details in top-left p
With the Technical Analysis indicator, you can find the trading signals using the combination of different technical indicators. It supports the following technical indicators: 1.     RSI 2.     Stochastic 3.     Stochastic RSI 4.     MACD 5.     ADX 6.     CCI 7.     ATR 8.     Ultimate Oscillator 9.     ROC 10.   Bull/Bear Power After you attached the indicator to a chart it will show the following information on the chart: 1.     Technical indicators, their values and the signal generated fro
Contact us for any custom order,   CodeYourTrade.com . With the Technical Indicator Multi-Timeframe, you can easily identify the oversold/overbought levels or buy/sell levels points on several different timeframes by using only one chart. You can confirm Short Term trades by higher timeframe Levels. It supports 4 technical indicators as of now Stochastic, RSI, Parabolic SAR & Heiken Ashi. After you attached the indicator to a chart it will show the following information on the chart: Timeframe
Contact us for any custom order,   CodeYourTrade.com . Trade Notifier indicator is used to notify opening or closing of the trades via email or alert. It can also send regular trade updates via email. After you attached the Indicator to a chart, it will show the following information on the chart: 1.     Alert information 2.     Email information 3.     Details to include in email body You can hide all the information displayed in the chart by setting  false  to  Display . Indicator Settings A
Contact us for any custom order,   CodeYourTrade.com . Trend Direction indicator finds the direction of the trend using 2 indicators ADX and Parabolic SAR. Change the color of the Sell and Buy strength from the Colors tab in indicator settings. After you attached the indicator to a chart it will show the following information on the chart: 1.     Parabolic SAR: Input values of Parabolic SAR Indicator 2.     ADX: Input values of ADX Indicator 3.     Trend Strength: Direction of the trend
Contact us for any custom order,   CodeYourTrade.com . Martingale EA is a multicurrency Expert Advisor using martingale or grid technique to trade the market. Trading strategy: Manual Entry + Automated Trade Management Manual Entry : User can input the starting trade type in the EA based on their analysis. The EA has no intelligence of its own to decide the entry trade type. Intelligence can be added in the EA upon request. Automated Trade Management : It manages the trade using martingale or gr
Contact us for any custom order, CodeYourTrade.com . Timed Close EA is used to close all the trades automatically at your specific time. You can set the EA using any of the 3 options: 1.     OneTime: In this option EA will run only once. Execute at that date-time and stops. 2.     Weekly: In this option EA will run at specific day-time every week. For example if you wanted to close all the trades before market close at Friday, you can use this option. 3.     Daily: In this option EA will run d
Straddle EA
HITESH ARORA
5 (2)
Contact us for any custom order,   CodeYourTrade.com . The main use of Straddle EA is to trade at the major fundamental news events. It opens 2 pending orders Buy Stop and Sell Stop to capture the market single direction movements at the time of news. The EA will run from "News Time – Seconds before News Time" to "Expiration Time". These are the sequence of states in the EA: Waiting : Before "News Time – Seconds before News Time". The EA is waiting to start. Passed : The EA started and trade ex
Contact us for any custom order,   CodeYourTrade.com . Profit and Loss Manager EA is to close the running or pending trades when reached to a specified profit or loss. EA works fully on virtual mode i.e. no hard Stop Loss or Take profit set. You can run the EA in any of the 3 modes: 1.     Per Trade : In this mode, actions are applied to all the trades separately. Rules are applied on a single trade separated, it’s profits/loss not combined with any other trades. 2.     Per Pair : In this mod
Contact us for any custom order,   CodeYourTrade.com . Partial Close EA is used to partially close running trades. EA has an option to filter out the trades and works only on specific trades. Following are the filters for the EA: 1.     Magic Number: Have an option to works on all orders with the given magic number 2.     Order Number: Can work specifically on the single order with the given order number 3.     Chart: Can work for all the trades of the current attached chart Example : Let’s sa
Contact us for any custom order,   CodeYourTrade.com . Brent Wti spread indicator shows the difference of Brent and Wti value. Trading Strategy: Identify the range of spread movement. To buy the difference execute these 2 trades “Buy BRENT and Sell WTI” To sell the difference execute these 2 trades “Sell WTI and Buy BRENT”   Indicator Settings: Main Setting Indicator Maximum : Maximum level to show in indicator Indicator Minimum : Minimum level to show in indicator Brent Symbol Name : Symbol n
Filter:
No reviews
Reply to review
Version 1.1 2020.03.22
Fixed Copyright information.