True SSRC nrp
- Indicators
- Sergey Efimenko
- Version: 1.1
- Updated: 24 October 2020
- Activations: 10
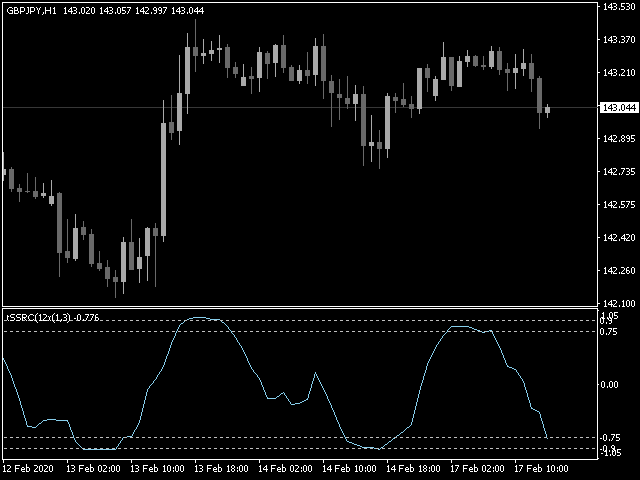
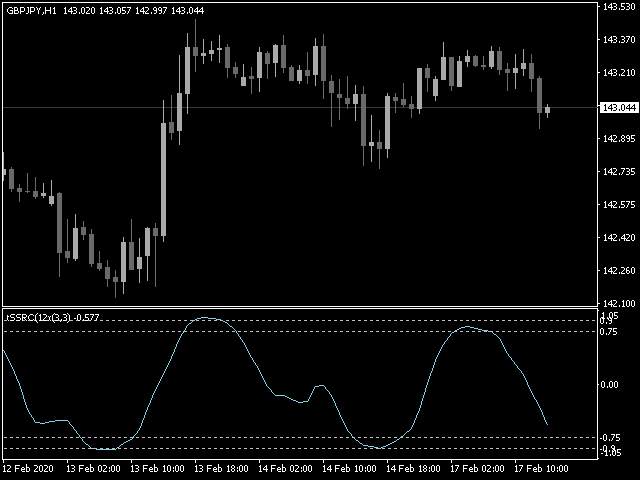
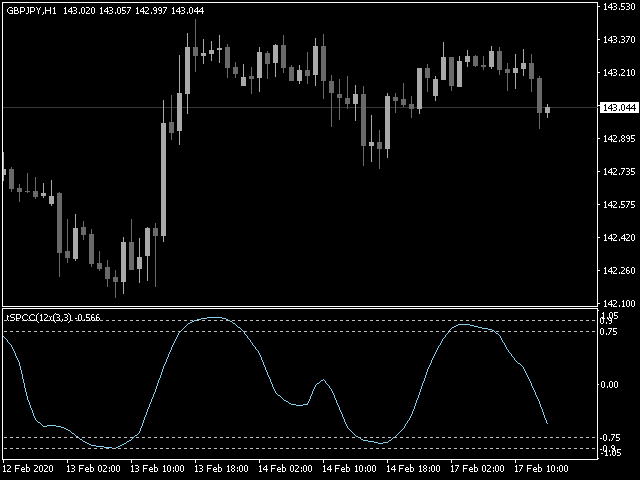
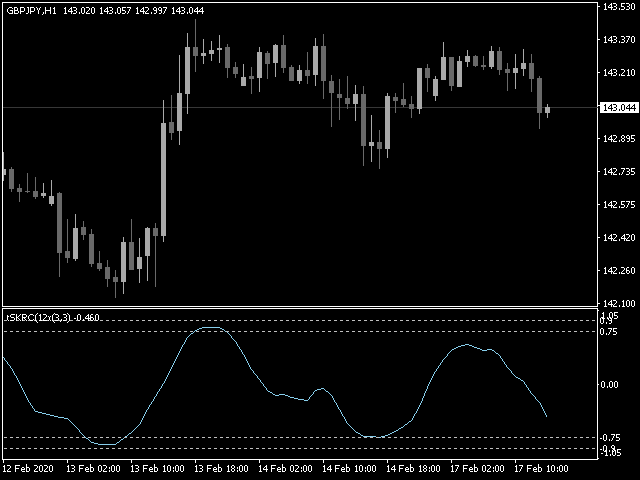
The indicator shows (optional): Spearman's rank correlation coefficient, Pearson's linear correlation coefficient, Kendall's rank correlation coefficient, and Fechner's sign correlation coefficient. This oscillator shows the points of possible market reversal when the price goes beyond the overbought and oversold levels.
There are 4 methods for additional filtering of the obtained values: simple, exponential, smoothed, linearly weighted.
After the bar is closed, the values are fixed and not repaint.
When using the Spearman calculation, we get the known SSRC, but in this indicator the true coefficient is calculated, and smoothing is applied to the result of the calculation, which avoids repainting the values.
Parameters:
- Calculation mode/period/price - mode/period, used price for calculating the correlation coefficient
- Smoothing period/method - period/method of smoothing the result value


Just bought 5 stars another amazing product from Author, am interested to buy your mt5 also but Author can you please see comment page and add the arrow on chart so that easier to see, once you added please let me know so can purchase your mt5 also, Thank you.