• Overview
  • Reviews (135)
  • Comments (263)
  • What's new

Market Reversal Alerts

4.19
LIMITED TIME SALE - 30% OFF, WAS $49, NOW $35!

Profit from market structure changes as price reverses and pulls back.

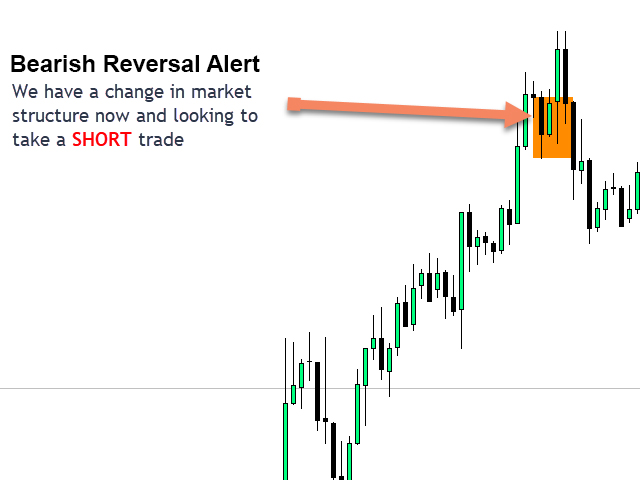
The market structure reversal alert indicator identifies when a trend or price move is approaching exhaustion and ready to reverse. It alerts you to changes in market structure which typically occur when a reversal or major pullback are about to happen.

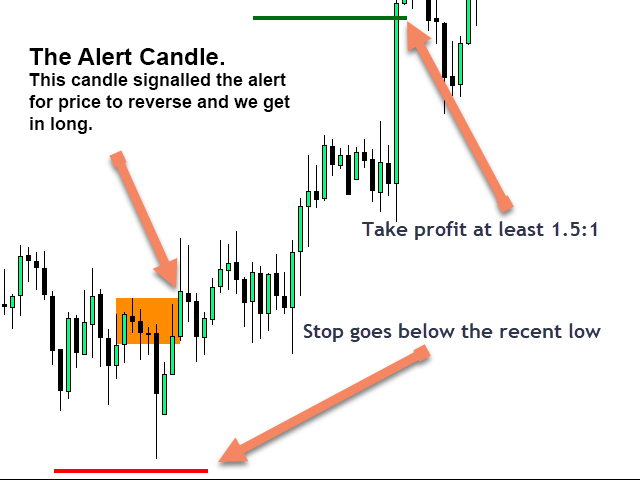
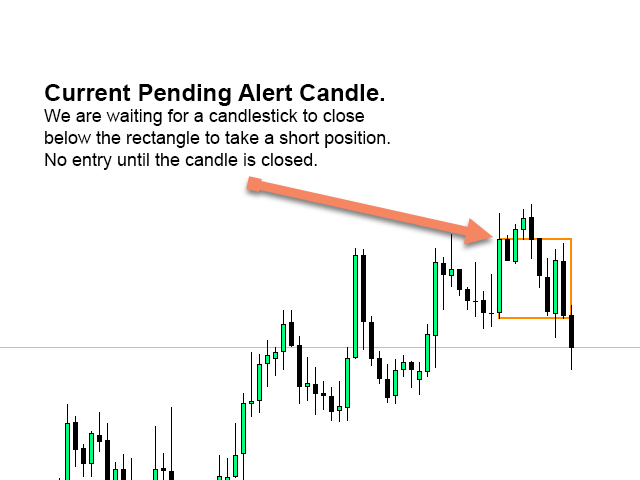
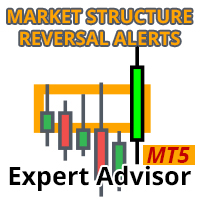
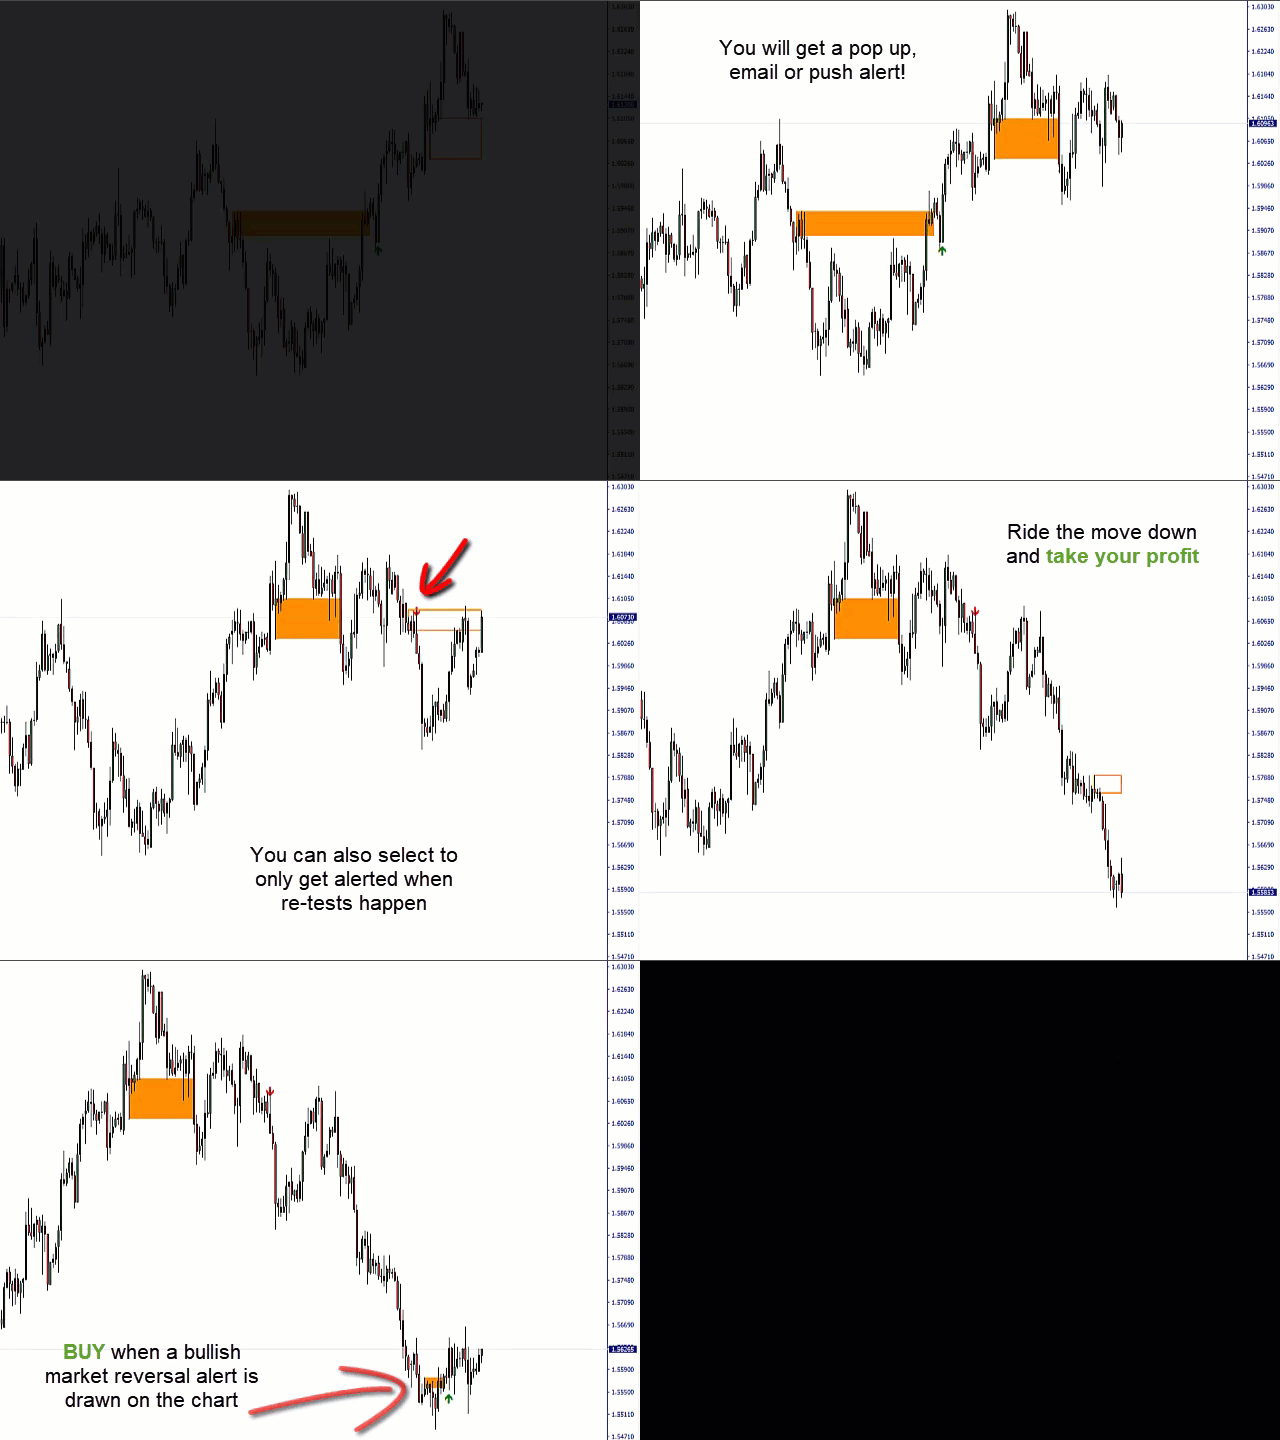
The indicator identifies breakouts and price momentum initially, every time a new high or low is formed near a possible exhaustion point. The indicator draws in a rectangle on the last opposite coloured candle. It will then trail the rectangle along with price as it continues to move in it's current short term trend. Once price weakens enough that it closes back above or below the rectangle this would indicate a potential shift in market structure is taking place. The indicator then alerts you to a potential shift in direction and the start of a possible reversal in trend or major pullback.

See the indicator in action below to see how it works!

Optional dashboard add-on to monitor ALL pairs and timeframes here: https://www.mql5.com/en/market/product/62751

EA available here: Auto trade market reversal alerts! https://www.mql5.com/en/market/product/65383

MT5 version available here: https://www.mql5.com/en/market/product/57892

Features

  • Alerts you to potential changes in market structure at key exhaustion points
  • Automatically draws in short term market structure as price approaches exhaustion levels
  • Trails the alert rectangles behind price as it moves in it's current trend direction to find the tightest entries
  • Changes colour to a solid block rectangle on alerts to show where potential reversals in market structure have occurred
  • Works on all symbols and timeframes
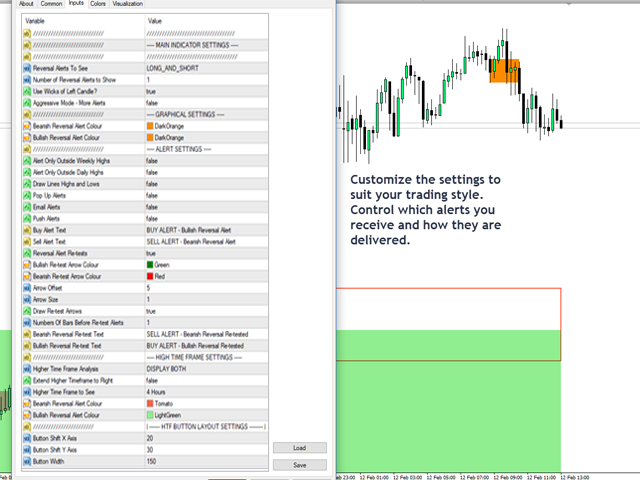
  • Integrated pop-up, push and email alerts built in
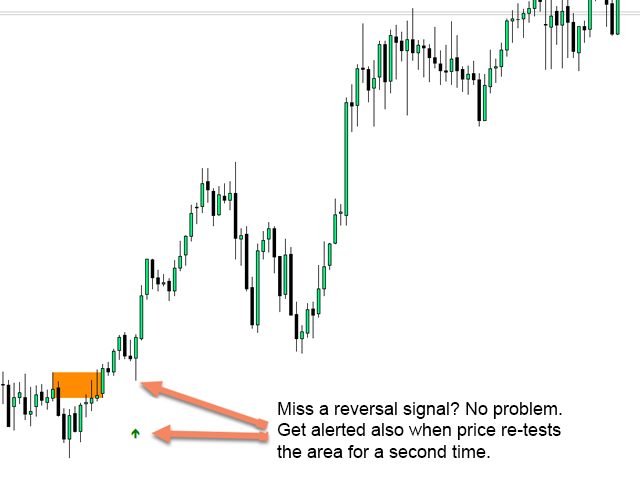
  • Alerts when a re-test of a reversal alert has happened confirming the entry as being more likely
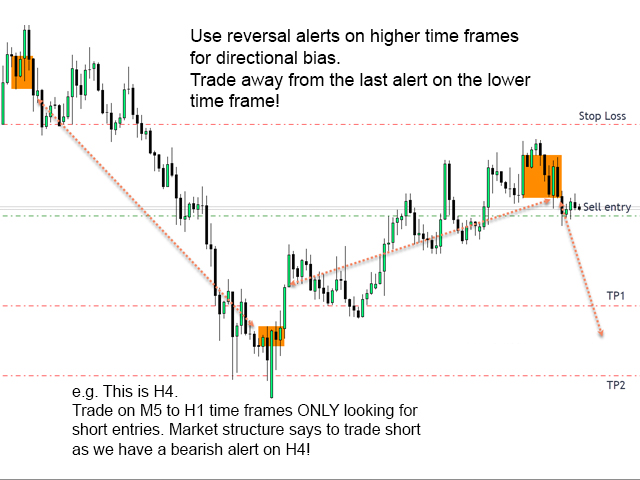
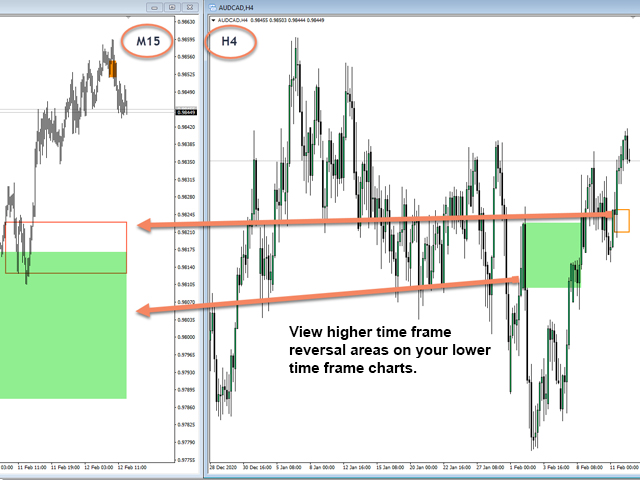
  • Allows you to view higher time frame reversal rectangles on your lower trading time frame. Great for trend traders and identifying higher time frame trend direction
  • Select all reversal alerts or just long or short alerts, select the directional alerts you want based on each pairs current trend direction
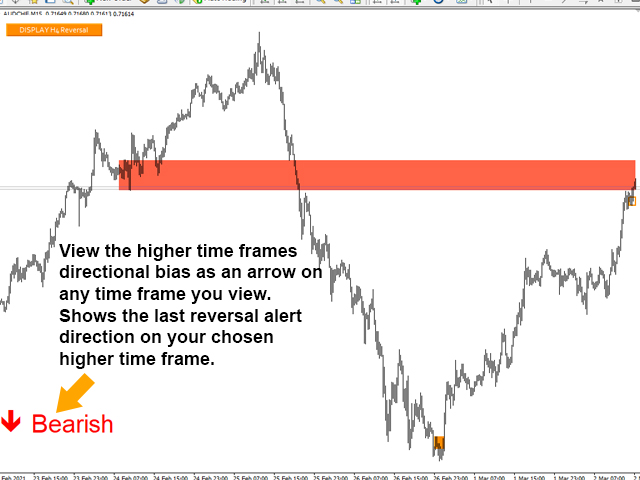
  • View higher time frame directional bias arrow on your lower time frame chart.

Strategy & How To Trade With The Market Structure Reversal Indicator

When a reversal alert occurs:

  1. Look left! Is there a supply/demand or support/resistance level that we're turning at. Market structure shifts (reversals) usually occur when price is retesting an old level or a stop hunt has just happened above that support or resistance level.
  2. Consult a higher time frame to see if there is an area of support/resistance we are turning at. As above changes in market structure will often happen on lower time frames when at major levels on a higher time frame.

If the above conditions are met simply place a trade in the direction of the reversal. 

You can add additional indicators as validation or use this indicator to add further validation to your existing indicators or strategy!

Stop Loss and Take Profit

Your stop should always go just above the most recent high or below the most recent low. If the reversal is correctly identifying a shift in market structure price will rarely move back above/below the most recent peak. The size of your stop will be dependent on how aggressive the last move to create the recent high was.

Take profit is up to the individual but using a 1.5:1 or 2:1 risk to reward is easily achievable. Entering 2 trades and having one trail along with price just above/below new rectangles as they are drawn on the chart can achieve 5:1 and higher risk reward.

Download the free demo to use in the strategy tester and see how it works.
See how big some of the moves are after the reversal alerts trigger!

    Reviews 20
    vincenzo1964
    943
    vincenzo1964 2024.04.09 21:36 
     

    Voglio essere sincero, l-utilizzo corretto di questo indicatore, insieme ad una buona lettura delle dinamiche di mercato[ e semplicemente straordinario. Un supporto visivo e corretto sorprendente, di quello che scrivo non ne guadagno niente, ma informo i colleghi traider di questa utilita. Buon trading a tutti

    mohamedelrashidy
    69
    mohamedelrashidy 2024.04.07 05:24 
     

    Hej godt work  It's really fantastic indicator but I'm really need alert just when the rectangle appear on the chart  So I hope that will be possible  Thanks 

    Yusuf Hamzah
    582
    Yusuf Hamzah 2023.11.19 07:40 
     

    A well thought indicator. It helps in a ranging market. Flexible user interface.

    Recommended products
    My Point MT4
    Claudia Ramona Angerer
    4 (1)
    Diagnosis of major and minor pivot Trend detection with many signals Can be used in all symbols Can be used in all time frames Settings: Back Show: The number of candles it displays If you need any adjustments, or have any questions or suggestions, message me How to trade: Blue: sell signal Red: buy signal Blue and red at the same time: no signal Exit signal: Opposite signal
    KT Tether Line MT4
    KEENBASE SOFTWARE SOLUTIONS
    The KT Tether Line is a trend-following tool consisting of three indicators that work together to generate trading signals. It can correctly identify market trends while signaling trade entries. It was first introduced by Bryan Strain in the Stock & Commodities magazine in 2000 in "How to get with the trend and out at the end." The Concept When a market trend is confirmed, the most challenging part is determining the timing of the entries. This indicator alerts you to potential trend reversal
    Special Agent
    Vitalii Zakharuk
    The advantage of working on the Special Agent signal indicator is that the trader does not need to independently conduct a technical analysis of the chart. Determining the market trend is an important task for traders, and the tool gives ready-made signals in the form of directional arrows. This tool is an arrow (signal). Special Agent is a trend indicator, a technical analysis tool that helps to determine the exact direction of the trend: either up or down price movement for a trading pair o
    Introducing the Donchian Channels indicator for MQL4, a powerful technical analysis tool designed to boost your trading success. This indicator consists of four lines that represent the upper and lower boundaries of price movement over a specified period. With the Donchian Channels indicator, you can easily identify potential breakouts and reversals in the market. The upper line shows the highest high of the specified period, while the lower line represents the lowest low. The space between thes
    This indicator uses multiple indicators to generate high-winning signal trades The R Signals indicator is a complete FX trading system that prints accurate buy & sell arrows on the chart. The indicator appears in the main MT4 chart window as colored green and red arrows. Using signals generated by a single indicator can be risky while trading. This is because using just one indicator to trade can give more false signals. Thus, many forex traders used three or more indicators to filter out g
    I  recommend you to read the   product's blog  (manual) from start to end so that it is clear from the beginning what the indicator offers. This multi time frame and multi symbol indicator scans for engulfing and tweezer formations. The indicator can also be used in single chart mode. Combined with your own rules and techniques, this indicator will allow you to create (or enhance) your own powerful system. Features Can monitor all symbols visible in your Market Watch window at the same time. Ap
    Clever RSI
    Carlos Forero
    Description Better version of RSI indicator which offer a complete visual trading strategy and realize an auto-optimization Support:   We create great tools for the entire trading community. Most of them are free. If you believe in what we do  Support Us Here.   KEY LINKS:   How to Install  –  Frequent Questions  -  All Products  How is this indicator useful? NEVER repaints. Detect best parameters of RSI indicator, based on profit factor during the specified period. This indicator can be used as
    I  recommend you to read the   product's blog  (manual) from start to end so that it is clear from the beginning what the indicator offers. This multi time frame and multi symbol indicator identifies double top/bottom, head & shoulders, pennant/triangle and flag patterns. It is also possible to setup alerts only when a neckline/triangle/flagpole breakout has occured (neckline breakout = confirmed signal for top/bottoms and head & shoulders).  The indicator can also be used in single chart mode.
    The intelligent algorithm of the Trend Detects indicator shows the points of potential market reversal. Strategy for trend trading, filtering market noise and all the necessary functions built into one tool! The system itself shows in the form of arrows when to buy and when to sell. Uses only one parameter for settings. Simple, visual and effective trend detection. Most often, a good trend is visible on the price chart visually. But an experienced trader must clearly understand the current ba
    Ross Hook is a price pattern indicator that help traders to forecast market inversions. The activation of the pattern could identify turning points by finding the breakout SR levels or technical analysis figures like triangles, rectangles or head and shoulder. The Indicator runs in  all Brokers  using  Metatrader 4  platform and can be used in an Expert Advisor or as a support of manual trading. This indicator is composed by the OnChart and OnWindow parts: OnChart : Draws the points 1, 2 and 3 t
    For this set of indicators 1. General information     - Calculates with high performance mathematical algorithms.     - Calculated from the price of candles     - The entry point of this order is filtered by the train EMA and the oscillator.     - Calculate the integrity of the candle 2. How does it work?     - You can see two types of order entry points: the notification on the monitor and the arrow.     - You can trust 75-95 percent of this entry point. 3. Settings     - A complete candle
    KT DMA is a modified and advanced version of the classic Displaced Moving Averages with buy/sell crossover alerts and a Multi-Timeframe scanner that shows DMA's direction across each real-time time frame. A Displaced Moving Average is a simple moving average that moves ahead or backward in a time frame (either short-term or long-term). It also allows you to predict price movement more accurately. Features Depicts the trend direction using the alignment of three moving averages. Buy/Sell signa
    Atr Mtf Trend
    Jalitha K Johny
    The Average True Range (ATR) is a tool to measure volatility. ATR MTF (Multi Time Frame) indicator provides all timeframe trends helps to identify in which kind of volatility environment the market .This indicator can be used with any Trading Systems for additional confirmation of trading entries or exits. It is a very helpful tool to calculate Targets and Stops according the current market conditions.
    Working with the Channel Motion Tracker indicator is as simple as possible. Just react to the arrows that the indicator displays. Each arrow represents an explicit command to action. The signals generated by this indicator are accurate enough to allow you to trade based on this information. One of the main advantages of the indicator is its ability to build high-quality channels and generate signals for entering the market. This is great for the trader who always finds it difficult to choose
    Pivot Point Fibo RSJ is an indicator that traces the support and resistance lines of the day using Fibonacci rates. This spectacular indicator creates up to 7 levels of support and resistance through Pivot Point using Fibonacci rates. It is fantastic how the prices respect each level of this support and resistance, where it is possible to perceive possible entry/exit points of an operation. Features Up to 7 levels of support and 7 levels of resistance Set the colors of the levels individual
    FREE
    Insight Pro is a comprehensive tool for market analysis. It offers various features such as trend analysis, resistance and support levels, and distribution analysis, suitable for both novice and experienced traders. Features Trend Analysis Detects and visualizes market trends. Suggests potential entry and exit points based on trends. Customizable trend lines for clear market direction. Displays extreme levels based on standard deviation. Positive slope indicates buy orders; negative slope indic
    The Power calculates the strength of the long and short forces by the ratio of the price breakthrough to the average amplitude of the previous market. When the intensity is strong, the signal appears on the chart to estimate the direction of the next wave. There is no future function for the indicator. All signals will not move or disappear after they appear, and have a good real-world reference value. The indicator parameters allow the user to make individual adjustments. More EA and Indicators
    TMoney OrderblockDay
    Moises Orlando Urbina Sojo
    The indicator is triggered at the start of each trading day and detects both bullish and bearish ORDERBLOCK potentials. These levels are of high operational probability, being able to use a minimum ratio of 3 to 1 to maximize profits. It is recommended to use TimeFrame M5 to M30 for a proper display and consider pending orders at the OB levels of the chart and place the SL up to a maximum of 20 pips from the entry price. Submit the indicator to Backtesting to become familiar with its performa
    Chart Analyzer
    Innovicient Limited
    The Chart Analyzer is an MT4 indicator that provides visual arrow signals without redrawing them. In addition, we have included trendlines to validate your entries. This indicator has been fine-tuned to work with all timeframes and instruments.  The Chart Analyzer has a number of advantages Does not fade or remove arrows when drawn Sends both email and phone alerts. It is light on computer resources Easy to install. Default setting works just fine.  If price opens above the trendline, open
    To access the TD sequential Scanner for MT5, please check https://www.mql5.com/en/market/product/123369?source=Site +Market+My+Products+Page. One of the MT5 versions includes additional timeframes such as M1, M2, M3,H2,H6,H8 and so on.( https://www.mql5.com/en/market/product/123367?source=Site +Market+My+Products+Page) TD Sequential Scanner: An Overview The TD Sequential scanner is a powerful technical analysis tool designed to identify potential price exhaustion points and trend reversals in fi
    KT Price Border MT4
    KEENBASE SOFTWARE SOLUTIONS
    KT Price Border creates a three-band price envelope that identifies potential swing high and low areas in the market. These levels can also be used as dynamic market support and resistance. The mid-band can also be used to identify the trend direction. As a result, it also functions as a trend-following indicator. In addition, its ease of use and more straightforward conveyance of trade signals significantly benefit new traders. Features It works well on most of the Forex currency pairs. It
    Multicurrency and multitimeframe indicator of the Standard Deviation Channel. Displays the current direction of the market. On the panel, you can see breakouts and touches (by price) of the levels of the linear regression channel. In the parameters, you can specify any desired currencies and timeframes. Also, the indicator can send notifications when levels are touched. By clicking on a cell, this symbol and period will be opened. This is MTF Scanner. The key to hide the dashboard from the char
    Candle Good Setup MT4
    Kibalo Alain Kabissa
    You ask yourself the question every time you open your charts: how to win in trading?   Will using a lot of indicators work? well know that I also asked myself the same questions when I first started trading. After testing many indicators, I realized that winning trading is simple and accurate trading. after several months of thinking and optimizing I was able to find my solution:   Candle Good Setup Candle Good setup is a trend and entry timing indicator analyzing the market in multi-frame to g
    Elephant Candle
    David Leander Tschacher
    The Elephant Candle is an indicator for MT4. It draws arrows when strong bullish or bearish candles appear. Strong candles frequently initiate a new trend. The arrows can be used in expert advisors. This indicator can improve already existing trading strategies. The indicator is very fast and doesn't repaint. Inputs Period Candle Multiplier Candle Niceness [%] Arrow Size Enable Alert Enable Push Notification Enable Email
    Price Level Alerts
    Snapdragon Systems Ltd
    Introduction This indicator alerts you when certain price levels are reached. The alert can be on an intrabar basis or on a closing price basis. It will also send alerts when one forms, including via e-mail or push notification to your phone . It's ideal for when you want to be notified of a price level being reached but don't want to have to sit in front of your chart all day. Input Parameters DoAlert: if set to true a desktop pop-up alert will appear from your MetaTrader terminal whe
    KT Horizontal Lines MT4
    KEENBASE SOFTWARE SOLUTIONS
    In MetaTrader, plotting multiple   horizontal lines   and then tracking their respective price levels can be a hassle. This indicator automatically plots multiple horizontal lines at equal intervals for setting price alerts, plotting support and resistance levels, and other manual purposes. This indicator is suitable for Forex traders who are new and looking for chances to make quick profits from buying and selling. Horizontal lines can help traders find possible areas to start trading when the
    The indicator monitors the MACD trend in multiple timeframes for a specific market. No more shifting in between charts to check the trend direction while trading. Key Features Indicator can be used for all markets Monitors every timeframe, from M1 to MN Able to move display label on chart by single click Indicator Usage The dashboard appears to the left and upper part of the chart when attached. The shell encapsulating a timeframe goes red on a down trend, green on an up trend. If the defaul
    A useful scanner/dashboard that shows the RSI values for multiple symbols and time-frames. It can be easily hidden/displayed with a simple click on the scanner man top left of the dashboard. You can input upper and lower RSI values and the colours can be set to show when above/below these values. The default values are 70 and 30. There are also input colours for when the RSI is above or below 50 (but not exceeding the upper/lower levels Symbols and time-frames are input separated by comma
    Retracement Feeder
    Innovicient Limited
    5 (1)
    The Retracement Feeder checks for retracement opportunities after the first move has occurred.  Basically it scans for the second wave of trend. Works with any financial instrument,  It does not repaint/change color or cancel arrows, Easy to set and use. Works great with Renko Charts MT5 version:  https://www.mql5.com/en/market/product/71340 How it works The indicator is based on RSI and Stochastics.  The algorithm used in the Retracement Feeder allows the Stochastic and RSI to minimiz
    Cloud Power
    Andriy Sydoruk
    Implementation of indication of trend movement with moments for potential stops in the Cloud Power indicator. The transition to the shadow warns of a possible reversal. The entry of the price inside the shadow speaks of a flat movement. The indicator tracks the market trend with unmatched reliability, ignoring sharp market fluctuations and noise around the average price. Simple, visual and efficient use. The indicator does not redraw and does not lag. It can be easily used as an independent
    Buyers of this product also purchase
    Gann Made Easy
    Oleg Rodin
    4.83 (92)
    Gann Made Easy is a professional and easy to use Forex trading system which is based on the best principles of trading using the theory of W.D. Gann. The indicator provides accurate BUY and SELL signals including Stop Loss and Take Profit levels. You can trade even on the go using PUSH notifications. PLEASE CONTACT ME AFTER PURCHASE TO GET MY TRADING TIPS PLUS A GREAT BONUS! Probably you already heard about the Gann trading methods before. Usually the Gann theory is a very complex thing not only
    - Real price is 80$ - 40% Discount ( It is 49$ now ) Contact me for instruction, add group and any questions! Related Products:  Bitcoin Expert , Gold Expert Introduction The breakout and retest strategy is traded support and resistance levels. it involves price breaking through a previous level.  The break and retest strategy is designed to help traders do two main things, the first is to avoid false breakouts. Many false breakouts start with a candlestick that breaks out of a level but ends w
    Bull versus Bear
    Mohamed Hassan
    4.8 (5)
    Official Release price of $65 for the first 27 /3 0  copies (3 copies left). Next price is $120 !  Send us a message after your purchase to receive more information on how to get your  BONUS  for FREE  that works in great combination with Bull vs Bear ! Bull versus Bear is an easy-to-use Forex indicator that gives traders clear and accurate signals based on clear trend retests . Forget about lagging indicators or staring at charts for hours because  Bull vs Bear provides real-time entries w
    FX Volume
    Daniel Stein
    4.58 (33)
    Visit our all-new   Stein Investments Welcome Page   to get the latest information, updates and trading strategies. FX Volume is the FIRST and ONLY volume indicator that provides a REAL insight into the market sentiment from a broker's point of view. It provides awesome insights into how institutional market participants, like brokers, are positioned in the Forex market, much faster than COT reports. Seeing this information directly on your chart is the real game-changer and breakthrough solut
    Atomic Analyst
    Issam Kassas
    5 (2)
    First of all Its worth emphasizing here that this Trading Indicator is   Non-Repainting , Non Redrawing and Non Lagging Indicator   Indicator, Which makes it ideal from both manual and robot trading.  User manual: settings, inputs and strategy . The Atomic Analyst  is a PA Price Action Indicator that uses Strength and Momentum of the price to find a better edge in the market. Equipped with Advanced filters which help remove noises and false signals, and Increase Trading Potential. Using Multipl
    TPSpro RFI Levels
    Roman Podpora
    4.82 (22)
    A key element in trading is zones or levels from which decisions to buy or sell a trading instrument are made. Despite attempts by major players to conceal their presence in the market, they inevitably leave traces. Our task was to learn how to identify these traces and interpret them correctly. INSTRUCTIONS    RUS    -    ENG            R ecommended to use with an indicator   -   TPSpro  TREND PRO -  Version MT5 Main functions: Displaying active zones for sellers and buyers! The indicator show
    Dynamic Forex28 Navigator
    Bernhard Schweigert
    5 (2)
    Dynamic Forex28 Navigator - The Next Generation Forex Trading Tool CURRENTLY 49% OFF. Dynamic Forex28 Navigator is the evolution of our long-time, popular indicators, combining the power of three into one: Advanced Currency Strength28 Indicator (695 reviews) + Advanced Currency IMPULSE with ALERT (520 reviews) + CS28 Combo Signals (recent Bonus) Details about the indicator   https://www.mql5.com/en/blogs/post/758844 What Does The Next-Generation Strength Indicator Offer? Everything you loved
    Scalper Inside PRO
    Alexey Minkov
    4.73 (56)
    An exclusive indicator that utilizes an innovative algorithm to swiftly and accurately determine the market trend. The indicator automatically calculates opening, closing, and profit levels, providing detailed trading statistics. With these features, you can choose the most appropriate trading instrument for the current market conditions. Additionally, you can easily integrate your own arrow indicators into Scalper Inside Pro to quickly evaluate their statistics and profitability. Scalper Inside
    TPSproTREND PrO
    Roman Podpora
    4.79 (19)
    TPSpro TRENDPRO  - is a trend indicator that automatically analyzes the market and provides information about the trend and each of its changes, as well as giving signals for entering trades without redrawing! The indicator uses each candle, analyzing them separately. referring to different impulses - up or down impulse. Exact entry points into transactions for currencies, crypto, metals, stocks, indices!  Version MT5             DETAILED DESCRIPTION              R ecommended to use with an indi
    FX Levels is an exceptionally accurate support and resistance indicator that merges the traditional Lighthouse method with an innovative dynamic approach, functioning flawlessly across all trading symbols. This includes currency pairs, indices, stocks, or commodities. FX Levels identifies reversal points and displays them on the chart, which can be ideally utilized as profit targets in your trading activities. In developing FX Levels, we have used our extensive experience with brokers and the v
    The Stochastic Basket Currency Strenght  brings the Stochastic indicator to a new level.  Expanding the boundaries of TimeFrames and mono-currency analysis, the SBCS take the movements of each currency that composes the cross and confront them in the whole basket of 7 crosses.  The indicator works with any combination of AUD, CAD, CHF, EUR, GBP, JPY, NZD, USD pairs and with full automation takes in account every stochastic value (main line) for the selected Time Frame.  After that, the indicator
    Trend Screener
    STE S.S.COMPANY
    4.81 (88)
    Unlock the Power of Trends Trading with the Trend Screener Indicator: Your Ultimate Trend Trading Solution powered by Fuzzy Logic and Multi-Currencies System! Elevate your trading game with the Trend Screener, the revolutionary trend indicator designed to transform your Metatrader into a powerful Trend Analyzer. This comprehensive tool leverages fuzzy logic and integrates over 13 premium features and three trading strategies, offering unmatched precision and versatility. LIMITED TIME OFFER : Sup
    FX Power MT4 NG
    Daniel Stein
    5 (13)
    Trading GOLD, and currencies, with the dog walk strategy  - super smart Trading GOLD, and currencies, with the breakout strategy  - super easy Visit our all-new   Stein Investments Welcome Page   to get the latest information, updates and trading strategies. FX Power MT4 NG  is the next generation of our long-time very popular currency strength meter, FX Power.  And what does this next-generation strength meter offer? Everything you have loved about the original FX Power  PLUS GOLD/XAU stre
    Introducing ON Trade Waves Patterns Harmonic Elliot Wolfe, an advanced indicator designed to detect various market patterns using both manual and automated methods. Here's how it works: Harmonic Patterns: This indicator can identify harmonic patterns that appear on your chart. These patterns are essential for traders practicing harmonic trading theory, as popularized by Scott Carney's book "Harmonic Trading vol 1&2." Whether you draw them manually or rely on automated detection, ON Trade Waves
    ACB Breakout Arrows
    KEENBASE SOFTWARE SOLUTIONS
    4.15 (34)
    The ACB Breakout Arrows indicator provides a crucial entry signal in the market by detecting a special breakout pattern. The indicator constantly scans the chart for a settling momentum in one direction and provide the accurate entry signal right before the major move.  Get multi-symbol and multi-timeframe scanner from here - Scanner for ACB Breakout Arrows MT4 Key features Stoploss and Take Profit levels are provided by the indicator. Comes with a MTF Scanner dashboard which tracks the brea
    Advanced Supply Demand
    Bernhard Schweigert
    4.91 (295)
    CURRENTLY 26% OFF !! Best Solution for any Newbie or Expert Trader! This indicator is a unique, high quality and affordable trading tool because we have incorporated a number of proprietary features and a new formula. With this update, you will be able to show double timeframe zones. You will not only be able to show a higher TF but to show both, the chart TF, PLUS the higher TF: SHOWING NESTED ZONES. All Supply Demand traders will love it. :) Important Information Revealed Maximize the potenti
    Gold Channel is a volatility-based indicator, developed with a specific timing algorithm for the XAUUSD pair, which consists of finding possible corrections in the market. This indicator shows two outer lines, an inner line (retracement line) and an arrow sign, where the theory of the channel is to help identify overbought and oversold conditions in the market. The market price will generally fall between the boundaries of the channel. If prices touch or move outside the channel it is a tra
    Scalper Vault
    Oleg Rodin
    5 (27)
    Scalper Vault is a professional scalping system which provides you with everything you need for successful scalping. This indicator is a complete trading system which can be used by forex and binary options traders. The recommended time frame is M5. The system provides you with accurate arrow signals in the direction of the trend. It also provides you with top and bottom signals and Gann market levels. The indicator provides all types of alerts including PUSH notifications. PLEASE CONTACT ME AFT
    Ultimate Gold Advisor for MetaTrader 4 The Ultimate Gold Advisor is an advanced technological tool designed to optimize the trading experience on MetaTrader 4. Created to meet the needs of experienced traders, this indicator combines precision, sophisticated analysis, and versatile functionality, offering support for informed trading decisions. Ideal for gold trading but also applicable across a wide range of assets, the Ultimate Gold Advisor can help you improve your market strategies. What ma
    This dashboard shows the latest available harmonic patterns for the selected symbols, so you will save time and be more efficient / MT5 version . Free Indicator:   Basic Harmonic Pattern Comparison of "Basic Harmonic Pattern" vs. "Basic Harmonic Patterns Dashboard" Indicators Feature Basic Harmonic Pattern Basic Harmonic Patterns Dashboard Functionality Detects and displays harmonic patterns on a single chart Searches multiple symbols and timeframes for harmonic patterns, displays result
    Stratos Pali
    Michela Russo
    5 (1)
    Stratos Pali Indicator   is a revolutionary tool designed to enhance your trading strategy by accurately identifying market trends. This sophisticated indicator uses a unique algorithm to generate a complete histogram, which records when the trend is Long or Short. When a trend reversal occurs, an arrow appears, indicating the new direction of the trend. Important Information Revealed Leave a review and contact me via mql5 message to receive My Top 5 set files for Stratos Pali at no cost! D
    PLEASE READ THE INFO DOWN BELOW BEFORE PURCHASING THE PRODUCT! Apollo Pips PLUS SP is a unique product!  IT IS FOR THOSE WHO WANT TO GET MY NEW "APOLLO PIPS" INDICATOR PLUS "SUPER PACK" BONUS WITH ACCESS TO ALL MY TRADING INDICATORS! By purchasing the Apollo Pips PLUS SP product you're actually purchasing an absolutely new version of my Apollo Pips indicator. This version of the indicator has got an improved algorithm and an easy to use parameter which gives you the opportunity to use the indica
    Currently 20% OFF ! Best Solution for any Newbie or Expert Trader! This dashboard software is working on 28 currency pairs plus one. It is based on 2 of our main indicators (Advanced Currency Strength 28 and Advanced Currency Impulse). It gives a great overview of the entire Forex market plus Gold or 1 indices. It shows Advanced Currency Strength values, currency speed of movement and signals for 28 Forex pairs in all (9) timeframes. Imagine how your trading will improve when you can watch the e
    CURRENTLY 26% OFF Best Solution for any Newbie or Expert Trader! This Indicator is a unique, high quality and affordable trading tool because we have incorporated a number of proprietary features and a new formula. With only ONE chart you can read Currency Strength for 28 Forex pairs! Imagine how your trading will improve because you are able to pinpoint the exact trigger point of a new trend or scalping opportunity? User manual: click here That's the first one, the original! Don't buy a worthle
    Currency Strength Wizard is a very powerful indicator that provides you with all-in-one solution for successful trading. The indicator calculates the power of this or that forex pair using the data of all currencies on multiple time frames. This data is represented in a form of easy to use currency index and currency power lines which you can use to see the power of this or that currency. All you need is attach the indicator to the chart you want to trade and the indicator will show you real str
    TPA True Price Action indicator reveals the true price action of the market makers through 100% non-repainting signals (except early signals mode) strictly at the close of a candle! TPA shows entries and re-entries, every time the bulls are definitely stronger than the bears and vice versa. Not to confuse with red/green candles. The shift of power gets confirmed at the earliest stage and is ONE exit strategy of several. There are available now two free parts of the TPA User Guide for our custo
    Market Structure Patterns MT4
    Samuel Manoel De Souza
    5 (16)
    Market Structure Patterns   is an indicator based on   smart money concepts   that displays   SMC/ICT   elements that can take your trading decisions to the next level. Take advantage of the   alerts ,   push notifications   and   email messages   to keep informed from when an element is formed on the chart, the price crosses a level and/or enters in a box/zone. Developers can access the values of the elements of the indicator using the   global variables  what allows the automation of trading
    Gann Swing Structure
    Kirill Borovskii
    5 (1)
    This indicator is based on the mathematics of the great trader W.D. Ganna. With its help, you can easily find strong levels by analyzing swings to find the optimal entry point. The indicator works on all instruments and all timeframes. The indicator is fully manual and has control buttons. All you need to do is press the NEW button, a segment will appear, which you can place on any movement, swing or even 1 candle that you want to analyze. By placing the segment, press the OK button. A grid (th
    IX Power MT4
    Daniel Stein
    5 (5)
    IX Power finally brings the unbeatable precision of FX Power to all your trading symbols. It accurately determines the intensity of short, medium and long-term trends in your favourite indices, stocks, commodities, ETFs, and even cryptocurrencies. You can analyse everything your terminal has to offer. Try it out and experience how your timing improves significantly when trading. Read about our latest strategic development -  Easy scalping with IX Power Visit our all-new   Stein Investments
    Trend Pulse
    Mohamed Hassan
    5 (4)
    Halloween Promotion   for   24 hours only   with a   40%   discount on the original price!  $̶6̶5̶  $39 ONLY!  Please contact me after purchase to immediately get your PDF strategy + documentation for Trend Pulse !  Introducing Trend Pulse , a unique and robust indicator capable of detecting bullish, bearish, and even ranging trends! Trend Pulse uses a special algorithm to filter out market noise with real precision. If the current symbol is moving sideways, Trend Pulse will send you a
    More from author
    Position Trader EA
    LEE SAMSON
    4.71 (7)
    LIMITED TIME SALE - 30% OFF, WAS $99, NOW $69! Turn any trading strategy into a position trading strategy or trade the proven RSI & ADR based position trading strategies, including automated drawdown control system for positions that move against you. This EA is an evolution and a simplification of the MRA EA that has been used for position trading strategies taught on the Market Structure Trader website for many years. See my profile for a link to the website, free position trading course and
    LIMITED TIME SALE - 30% OFF, WAS $49, NOW $35! Automatically draw support and resistance levels PLUS propulsion candle gaps on your chart, so you can see where price is likely to head next and/or potentially reverse. This indicator is designed to be used as part of the position trading methodology taught on my website (The Market Structure Trader) and displays key information for targeting and potential entries. MT version available here:  https://www.mql5.com/en/market/product/97973 There are
    LIMITED TIME SALE - 30% OFF, WAS $99, NOW $69! The Market Reversal EA is powered by the indicator of the same name ( available here ) and trades based on market structure shifts. The EA will by default take a trade every time a market reversal alert is sent by the indicator and will trade those alerts based on the conditions and filters you set in the EA settings. It draws support rectangles as price moves in it's current trend direction and trades when price reverses sharply and signals a mark
    LIMITED TIME SALE - 30% OFF, WAS $49, NOW $35! The RSI / TDI alert dashboard allows you to monitor RSIs at once (selectable by you) on every major pair you trade. You can use it in two ways: 1. Select multiple time frames and the dash will show you when there are multiple time frames extended beyond normal trading conditions. A great indicator that price has pushed hard recently as it has achieved an overbought or oversold level across multiple time frames so a pullback or reversal is due soon.
    LIMITED TIME SALE - 30% OFF, WAS $49, NOW $35! This dashboard is an alert tool for use with the market structure reversal indicator. It's primary purpose is to alert you to reversal opportunities on specific time frames and also to the re-tests of the alerts (confirmation) as the indicator does. The dashboard is designed to sit on a chart on it's own and work in the background to send you alerts on your chosen pairs and timeframes. It was developed after many people requested a dash to monitor
    LIMITED TIME SALE - 30% OFF, WAS $99, NOW $69! Turn any trading strategy into a position trading strategy or trade the proven RSI & ADR based position trading strategies, including automated drawdown control system for positions that move against you. This EA is an evolution and a simplification of the MRA EA that has been used for position trading strategies taught on the Market Structure Trader website for many years. See my profile for a link to the website, free position trading course and
    ADR Alert Dashboard
    LEE SAMSON
    3.83 (12)
    LIMITED TIME SALE - 30% OFF, WAS $49, NOW $35! The ADR Alert Dashboard shows you at a glance where price is currently trading in relation to it's normal average daily range. You will get instant alerts via pop-up, email or push when price exceeds it's average range and levels above it of your choosing so you can jump into pullbacks and reversals quickly. The dash is designed to be placed on a blank chart and just sit in the background and alert you when levels are hit so you do not need to sit
    LIMITED TIME SALE - 30% OFF, WAS $49, NOW $35! Profit from market structure changes as price reverses and pulls back. The market structure reversal alert indicator identifies when a trend or price move is approaching exhaustion and ready to reverse. It alerts you to changes in market structure which typically occur when a reversal or major pullback are about to happen. The indicator identifies breakouts and price momentum initially, every time a new high or low is formed near a possible exhaust
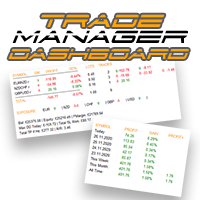
    LIMITED TIME SALE - 30% OFF, WAS $49, NOW $35! Take control of your forex portfolio. See instantly where you stand, whats working and whats causing you pain! MT5 VERSION AVAILABLE HERE:  https://www.mql5.com/en/market/product/58658 The Trade Manager Dashboard is designed to show you at a glance where each position you have in the forex market currently is, and make risk management and exposure to currencies easier to understand. For traders that scale into the market gradually with multiple p
    LIMITED TIME SALE - 30% OFF, WAS $49, NOW $35! A symmetrical triangle chart pattern represents a period of contraction & consolidation before the price is forced to breakout to the upside or breakdown. A breakdown from the lower trendline marks the start of a new bearish trend, while a breakout from the upper trendline indicates the start of a new bullish trend. Get the dashboard to monitor all instruments and time frames you trade for symmetrical triangle patterns at once! https://www.mql5.co
    LIMITED TIME SALE - 30% OFF, WAS $99, NOW $69! The Market Reversal Alerts EA is powered by the indicator of the same name ( available here ) and trades based on market structure shifts. The EA will by default take a trade every time a market reversal alert is sent by the indicator and will trade those alerts based on the conditions and filters you set in the EA settings. It draws support rectangles as price moves in it's current trend direction and trades when price reverses sharply and signals
    LIMITED TIME SALE - 30% OFF, WAS $99, NOW $69! Profit from the explosive moves that occur at the open of stock indices and give yourself an actionable edge every day. The opening range breakout EA can be tweaked to your liking to capture the trends that form just after the open every day on the main stock indices like the DAX, DOW, NASDAQ and S&P500. These opens happen at the same time every day so you know when volatility will occur and often just after the open strong trends form which you ca
    LIMITED TIME SALE - 30% OFF, WAS $99, NOW $69! Profit from the explosive moves that occur at the open of stock indices and give yourself an actionable edge every day. The opening range breakout EA can be tweaked to your liking to capture the trends that form just after the open every day on the main stock indices like the DAX, DOW, NASDAQ and S&P500. These opens happen at the same time every day, so you know when volatility will occur, and often just after the open strong trends form which you
    LIMITED TIME SALE - 30% OFF, WAS $49, NOW $35! The ADR Reversal Indicator shows you at a glance where price is currently trading in relation to it's normal average daily range. You will get instant alerts via pop-up, email or push when price exceeds it's average range and levels above it of your choosing so you can jump into pullbacks and reversals quickly. The indicator draws horizontal lines on the chart at the average daily range extremes and also extensions above those levels which have mat
    LIMITED TIME SALE - 30% OFF, WAS $99, NOW $69! Take advantage of the opening volatility of the major stock indexes and profit from the sudden moves created at those times when the market breaks away at the opening bell. The strategies' goal is to simply benefit from those days when the market moves fast and hard in one direction at the open and bank that move. If the market opens weak and directionless, the EA locks in a hedge loss and waits for the market to decide on a direction before exitin
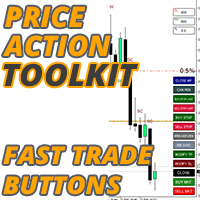
    LIMITED TIME SALE - 30% OFF, WAS $99, NOW $69! The price action toolkit EA is designed for scalpers but can be used on all timeframes to quickly enter the market with correctly calculated lot sizing based on your stop level, It allows you to quickly enter trades (instantly or at candle highs and lows with pending orders) and then adjust stops and take profits as the market moves. For a full list of all the features, settings and best practice strategy to use click here:  https://www.mql5.com/en
    LIMITED TIME SALE - 30% OFF, WAS $49, NOW $35! The ADR Reversal Indicator shows you at a glance where price is currently trading in relation to it's normal average daily range. You will get instant alerts via pop-up, email or push when price exceeds it's average range and levels above it of your choosing so you can jump into pullbacks and reversals quickly. The indicator draws horizontal lines on the chart at the average daily range extremes and also extensions above those levels which have mat
    LIMITED TIME SALE - 30% OFF, WAS $49, NOW $35! Take control of your forex portfolio. See instantly where you stand, whats working and whats causing you pain! MT4 VERSION AVAILABLE HERE:  https://www.mql5.com/en/market/product/58375 The Trade Manager Dashboard is designed to show you at a glance where each position you have in the forex market currently is, and make risk management and exposure to currencies easier to understand.   For traders that scale into the market gradually with multiple
    LIMITED TIME SALE - 30% OFF, WAS $49, NOW $35! The RSI / TDI alert dashboard allows you to monitor RSIs at once (selectable by you) on every major pair you trade. You can use it in two ways: 1.   Select multiple time frames and the dash will show you when there are multiple time frames extended beyond normal trading conditions. A great indicator that price has pushed hard recently as it has achieved an overbought or oversold level across multiple time frames so a pullback or reversal is due soo
    LIMITED TIME SALE - 30% OFF, WAS $49, NOW $35! Automatically draw support and resistance levels   PLUS   propulsion candle gaps on your chart, so you can see where price is likely to head next and/or potentially reverse. This indicator is designed to be used as part of the position trading methodology taught on my website (The Market Structure Trader) and displays key information for targeting and potential entries. MT4 Version:  https://www.mql5.com/en/market/product/97246/ There are 2 CORE fe
    LIMITED TIME SALE - 30% OFF, WAS $49, NOW $35! The ADR Alert Dashboard shows you at a glance where price is currently trading in relation to it's normal average daily range. You will get instant alerts via pop-up, email or push when price exceeds it's average range and levels above it of your choosing so you can jump into pullbacks and reversals quickly. The dash is designed to be placed on a blank chart and just sit in the background and alert you when levels are hit so you do not need to sit
    LIMITED TIME SALE - 30% OFF, WAS $49, NOW $35! This dashboard is an alert tool for use with the market structure reversal indicator. It's primary purpose is to alert you to reversal opportunities on specific time frames and also to the re-tests of the alerts (confirmation) as the indicator does. The dashboard is designed to sit on a chart on it's own and work in the background to send you alerts on your chosen pairs and timeframes. It was developed after many people requested a dash to monitor
    LIMITED TIME SALE - 30% OFF, WAS $99, NOW $69! Take advantage of the opening volatility of the major stock indexes and profit from the sudden moves created at those times when the market breaks away at the opening bell. The strategies' goal is to simply benefit from those days when the market moves fast and hard in one direction at the open and bank that move. If the market opens weak and directionless, the EA locks in a hedge loss and waits for the market to decide on a direction before exitin
    LIMITED TIME SALE - 30% OFF, WAS $99, NOW $69! The price action toolkit EA is designed for scalpers but can be used on all timeframes to quickly enter the market with correctly calculated lot sizing based on your stop level, It allows you to quickly enter trades (instantly or at candle highs and lows with pending orders) and then adjust stops and take profits as the market moves. For a full list of all the features, settings and best practice strategy click here:  https://www.mql5.com/en/blogs/
    LIMITED TIME SALE - 30% OFF, WAS $49, NOW $35! A symmetrical triangle chart pattern represents a period of contraction & consolidation before the price is forced to breakout to the upside or breakdown. A breakdown from the lower trendline marks the start of a new bearish trend, while a breakout from the upper trendline indicates the start of a new bullish trend. MT4 Version Available Here:  https://www.mql5.com/en/market/product/68709/ This indicator identifies these patterns and alerts you whe
    LIMITED TIME SALE - 30% OFF, WAS $49, NOW $35! The symmetrical triangle pattern dashboard allows you to monitor multiple markets and timeframes at once for symmetrical triangle patterns as draw by the symmetrical triangle pattern indicator available here: https://www.mql5.com/en/market/product/68709/ Visit the above indicator to learn more about how symmetrical triangle patterns are formed and simple to follow strategies to trade them. The dashboard is a stand-alone product and DOES NOT requi
    AT LAST! A stochastic indicator for MT4 that shows multiple time frames on one chart ! See the actual position of the main and signal lines in 4 separate time frames instantly to help you make educated trading decisions.A true MTF stochastic indicator for traders that need to see visually what the indicator is telling them on multiple time frames, no arrows that just point up or down or numbers displayed. No more flicking between time frames to see where other stochastics are positioned! Stay on
    FREE
    Filter:
    vincenzo1964
    943
    vincenzo1964 2024.04.09 21:36 
     

    Voglio essere sincero, l-utilizzo corretto di questo indicatore, insieme ad una buona lettura delle dinamiche di mercato[ e semplicemente straordinario. Un supporto visivo e corretto sorprendente, di quello che scrivo non ne guadagno niente, ma informo i colleghi traider di questa utilita. Buon trading a tutti

    mohamedelrashidy
    69
    mohamedelrashidy 2024.04.07 05:24 
     

    Hej godt work  It's really fantastic indicator but I'm really need alert just when the rectangle appear on the chart  So I hope that will be possible  Thanks 

    Yusuf Hamzah
    582
    Yusuf Hamzah 2023.11.19 07:40 
     

    A well thought indicator. It helps in a ranging market. Flexible user interface.

    [Deleted] 2023.11.07 09:45 
     

    User didn't leave any comment to the rating

    LEE SAMSON
    64759
    Reply from developer LEE SAMSON 2023.11.07 10:40
    Will just repeat what has already been typed below to people who dont understand what the indicator is doing and how it should be used. The indicator draws the latest market structure on the chart. Market structure constantly changes, so this is by design and fully explained why it does this in the videos about the indicator which it seems you have not watched or maybe not understood? Watch the content and understand the product, help is available in the Telegram group if you need more. Links on the website here https://themarketstructuretrader.com/ along with the education (over 20 hours of it) to help you with market structure trading strategies and using the indicator. Will also add onto the end here that I trade using this indicator LIVE every day and have done for over 2 years making profit constantly. Live room link is on the website. Come join me if you want to learn how this indicator works. I give all this education free and have done for many years for 2-4 hours per day.
    Sergio Ostapyuk
    58
    Sergio Ostapyuk 2023.06.01 11:56 
     

    Даю 5 зірок , класний ідекатор, працюю на м5 точки входу малює ідеальні, і рискреворд крутий. флет ідеально, а на тренді можна робити доливочки, пушка

    customanalog
    154
    customanalog 2023.05.24 17:57 
     

    If you're used to traditional indicators, this one will open your eyes. Breaker blocks are part of a whole different perspective, along with concepts like order blocks, equilibrium, and FVGs used in price action trading. Congrats to the author!

    Luca357
    74
    Luca357 2023.04.19 14:00 
     

    Awesome indicator for market structure traders! Excellent support and a very nice community.

    mehran afshar
    134
    mehran afshar 2023.03.10 05:57 
     

    Wrong signals are removed from the screen and only correct signals remain So you think this indicator is great But when you use it, you will realize that it is a fraud Because tomorrow all its wrong signals will be deleted

    LEE SAMSON
    64759
    Reply from developer LEE SAMSON 2023.03.10 07:21
    The indicator draws the latest market structure on the chart. Market structure constantly changes, so this is by design and fully explained why it does this in the videos about the indicator which it seems you have not watched or maybe not understood? Watch the content and understand the product, help is available in the Telegram group if you need more. Links on the website here https://themarketstructuretrader.com/ along with the education (over 20 hours of it) to help you with market structure trading strategies and using the indicator.
    jamielee183
    264
    jamielee183 2023.01.11 08:18 
     

    User didn't leave any comment to the rating

    LEE SAMSON
    64759
    Reply from developer LEE SAMSON 2023.01.11 08:44
    Thanks Jamie, glad you're finding value in the indicators and the content I produce every day. :)
    Sonny Soeyono Hoo
    141
    Sonny Soeyono Hoo 2023.01.11 07:42 
     

    Indicators are very helpful in reading the direction of the trend, so my open positions always follow the direction of the big trend which is 100% very suitable to be combined with any trading technique, just try it yourself you will be amazed

    LEE SAMSON
    64759
    Reply from developer LEE SAMSON 2023.01.11 07:55
    Glad it's helping and 100% right to only take signals in line with some sort of confluence like the HTF trend or a level of support/resistance. :)
    Cristian Mantovani
    2922
    Cristian Mantovani 2022.11.25 07:46 
     

    Why does the indicator give different signals depending on the brokers?

    LEE SAMSON
    64759
    Reply from developer LEE SAMSON 2022.11.25 08:09
    Can be one of two things. 1. Different prices being quoted by different brokers will give different readings for all indicators. 2. Different settings maybe with the indicator on the different platforms
    Shahid Khan uk
    82
    Shahid Khan uk 2022.11.19 17:46 
     

    just wait of money,,not recommended

    LEE SAMSON
    64759
    Reply from developer LEE SAMSON 2022.11.19 17:54
    Why? Maybe you dont understand what the indicator is showing you. Check out the many hours of free education on the website that explains how to use the indicator profitably. https://themarketstructuretrader.com/free-forex-training-education-courses/ Also come in the Telegram group. Not seen you active in there asking for any assistance, 5000+ people in there that can help you understand how to use it.
    tuan.anh
    56
    tuan.anh 2022.11.16 04:51 
     

    I just bought it. However, since I bought it, I have to delete and redo it every day for the program to work. Not sure if it works properly?

    LEE SAMSON
    64759
    Reply from developer LEE SAMSON 2022.11.16 07:01
    Come in the Telegram group if you need support. Indicator works fine, will be an issue with your template or terminal we can help with. https://t.me/market_structure_trader_chat
    angel
    315
    angel 2022.10.13 07:29 
     

    Хороший индикатор

    ProTrader225
    84
    ProTrader225 2022.09.28 10:59 
     

    great Indicator. I always follow what it does and keep it simple. I like reversal patterns :)

    Happyday2020
    24
    Happyday2020 2022.09.06 21:40 
     

    Hello, I bought the Market Structure Reversal alert indicator and having a problem with activation. Please how do I contact support or Authur for help?

    LEE SAMSON
    64759
    Reply from developer LEE SAMSON 2022.09.06 21:54
    Shouldn't leave a review if just asking a question. Activation, you just download from your terminal. https://www.metatrader4.com/en/trading-platform/help/overview/terminal/toolbox_market#buy
    cfmtrader
    44
    cfmtrader 2022.07.14 03:03 
     

    Excelente indicador! funciona tal como se describe, lo recomiendo!

    tomburton89
    24
    tomburton89 2022.07.10 17:02 
     

    Great indicator, does exactly as it is supposed to do and I have not seen a repaint, it just show different structures on different timeframes. Only thing is I switched brokers and am now using MT5 instead of MT4, and don't wanna buy the same product twice. Thanks for reading

    Alexey Taran
    719
    Alexey Taran 2022.07.02 19:06 
     

    Перерисовывает, на истории не отображает!

    LEE SAMSON
    64759
    Reply from developer LEE SAMSON 2022.07.03 08:51
    Draws markets structure breaks. Please watch the videos about the indicator. You have completeley misunderstood what this indicator is showing you.
    ahmetb038
    147
    ahmetb038 2022.06.10 13:09 
     

    It is repaint indicator. It shows potential reversal area. You have to combine it with others. I dont suggest it alone.

    LEE SAMSON
    64759
    Reply from developer LEE SAMSON 2022.06.10 13:24
    No, it draws in market structure for you, Market strucutre changes. As you have said and is covered in the hours of video content accompanying this indicator, you need confluence with it. Why the 1 star!
    Reply to review
    Version 5.10 2021.11.12
    OPTIONAL UPDATE: Fixes an issue where the HTF reversal alerts would dissapear on candle updates on the M1 timeframe only. If you dont trade using the HTf function or use M1 then not a required update.
    Version 5.0 2021.04.20
    Updated indicator for name change
    Version 4.0 2021.03.02
    Added additional feature to give HTF directional arrow on all lower time frames viewed.
    Tweak to order block drawing logic.
    Added support for the new re-test dashboard add-on product.
    Version 3.0 2021.02.12
    MAJOR UPDATE: New features added.
    Vies higher time frame order blocks and breakers on the time frame you are trading.
    Ability to hide higher time frame breakers if needed.
    New breaker retest arrows and alerts. Very powerful confirmations of breaker trend reversals. Alerts for re-tests.
    Ability to set the indicator to just alert on long or short breakers. Great for monitoring pairs you want to nly enter in one direction for, trend based trading.
    Version 2.20 2020.09.04
    Now added push notifications to the indicator which can be turned on/off in the settings.
    Version 2.10 2020.05.07
    Updated indicator to allow fine tuning of the SEMAFOR settings which are used to create the breaker blocks. This is due to popular demand from some traders using it for specific strategies. Not to be changed for everyday use.