• Overview
  • Reviews (2)
  • Comments (3)
  • What's new

MultiCharts MT4

5

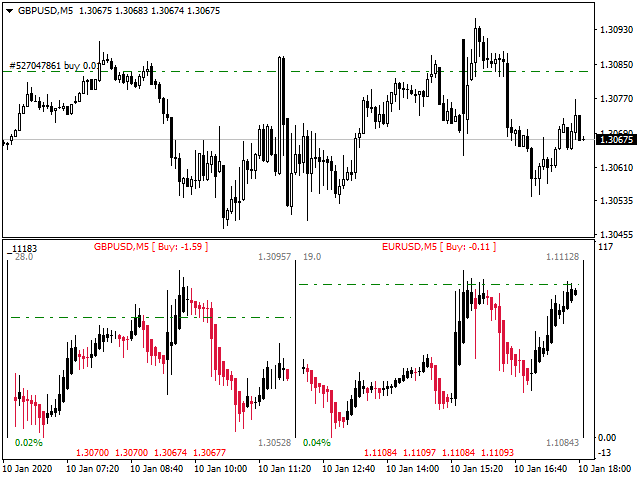
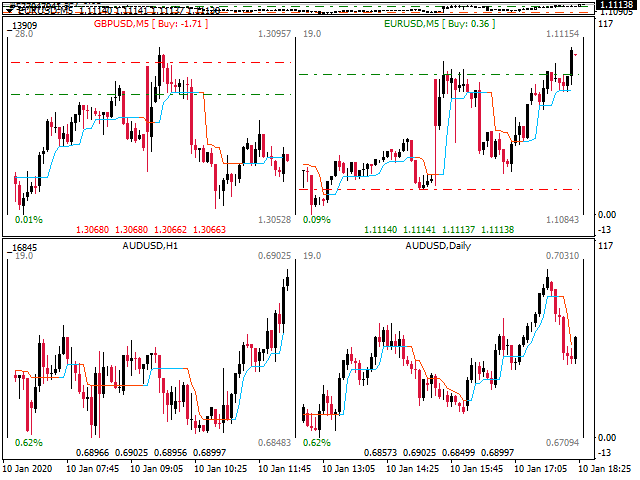
MultiCharts is a multi-currency indicator for visual analysis of several trading symbols.

  • in a separate window plots the selected symbols;
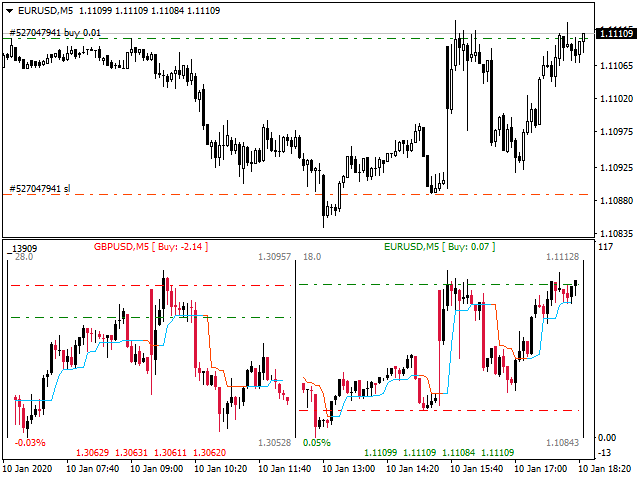
  • shows the levels of any established orders;
  • shows profit/loss, number and type of open positions;
  • builds technical indicators Moving Average, SDL, Trend filter and Heiken Ashi charts;
  • shows the spread, OHLC-prices of the current bar;
  • shows the relative price change for the current day*;

* - for periods before Daily and Daily inclusive, the price change is calculated for the current day. Above Daily period - for the selected period (current week, current month).

All the listed properties can be easily changed by the user at any time, through the input parameters of the indicator.

Color scheme of the indicator:
  • Bear candle color - color for bearish candles;
  • Bull candle color - color for bullish candles;
  • Labels color - text color (symbol name, OHLC);
  • Labels TP color - text color, if the price is approaching the Take Profit level;
  • Labels SL color - text color, if the price is approaching the Stop Loss level;
  • Profit color - text color, if the trade symbol has a profit;
  • Loss color - text color, if the trade symbol has a loss;
  • Text color - text color (spread, price change, cell borders);
  • Orders line color - color for lines of positions and pending orders;
  • Stops line color - color for lines of Stop Loss and Take Profit levels;
  • Fast MA color - the color of the indicator line Moving Average, Trend filter;
  • Slow MA color - the color of the indicator line Moving Average, Trend filter;

Settings of Moving Average indicators:

  • Fast MA period - the period of the"fast" moving average;
  • Slow MA period - the period of the "slow" moving average;
  • MA method - averaging method;
  • Applied price - a set of prices for calculating the indicator;

Trend filter indicator settings:

  • Trend filter period - the period of the Trend filter indicator (the recommended period for entering the indicator from 2 to 5);
  • Trend filter MA metod - averaging method;

SDL indicator settings:

  • SDL period - SDL indicator period;
  • SDL MA method - averaging method;
  • SDL applied price - a set of prices for calculating the indicator;

The indicator interface:

  • Add Indicator - show technical indicators Moving Average, Trend filter or Heiken Ashi charts;
  • Show OHLC prices - show OHLC prices;
  • Draw orders - show orders lines;
  • Monitoring positions - show the number and total profit/loss on open positions;
  • Show profit - a way to display profit/loss on open positions (in points or in the Deposit currency);
  • Show growth - to show the growth;
  • Orders line style - line style for orders;
  • Allow Email notifications - send email notifications when the Trend filter, SDL indicator signals appear; 
  • Allow Alert - use an alert when the Trend filter, SDL indicator signals appear;
  • Allow Push notifications - send notifications to the mobile terminal when the Trend filter, SDL indicator signals appear; 
  • Broker company label - company name for use in Push notifications, for example: (MQ MT4) - ' EURUSD, H1: Possible change trend direction on uptrend!'. If you put the symbol - ?, the default company name will be used;
  • UID - the unique number of the indicator. If there is more than one copy of the indicator on the chart, then you need to set a unique number for each copy;
  • Open chart in the... - open the chart window when you click on the symbol name in the current window or new window;
  • Chart 1....Chart 6 - the name of the trading symbols (EURUSD,M5 ... USDCAD,H1);
  • Allowed pairs for Notifications - names of trading pairs for which notifications are allowed. Specify, separated by a space, pairs on which notifications are allowed, for example: EURUSD, M5 GBPUSD, H1 USDJPY, M15 If the parameter is left blank, then notifications will be allowed for all pairs specified in the indicator settings (Chart1 ... Chart6).
    Reviews 2
    Iqbal Aroussi
    114
    Iqbal Aroussi 2020.05.10 15:43 
     

    A very good tool to visualize and analyze several trading symbols quickly. Without the need of having multiple monitors.

    Very useful when you're on the move, like traveling or simply not at your trading desk, working from your laptop.

    I contacted the Dev Ruslan a Sunday morning for an issue regarding the indicator not working on my Linux MT4 installation. I was amazed that he fixed quickly and uploaded the new version to Market Place within the hour that we chatted.

    I'm a happy buyer of the full version, really worth it.

    Iqbal

    Recommended products
    UPD1 Fibo Levels
    Vitaliy Kuznetsov
    5 (3)
    The indicator analyzes the specified number of candles and plots Fibonacci levels based on the high-low. Since the levels are rearranging, we are interested in the right side of the range. The price magnetizes the levels and reacts to the touch. Use this tool to find a trend entry point after a correction. If on the left we see that the levels have risen perfectly, then we can assume that we have found the end of the movement at the extreme point. All lines are drawn through buffers or objects (
    FREE
    Simply drop the indicator to the chart and Fibonacci levels will be shown automatically! The indicator is developed for automatic drawing of Fibonacci levels on the chart. It provides the abilities to: Select the standard Fibo levels to be shown Add custom levels Draw the indicator on the timeframes other than the current one. For example, the indicator is calculated on the weekly period (W1) and is displayed on the monthly period (MN1) Select the timeframes the indicator will be available on Ca
    Free automatic Fibonacci is an indicator that automatically plots a Fibonacci retracement based on the number of bars you select on the BarsToScan setting in the indicator. The Fibonacci is automatically updated in real time as new highest and lowest values appears amongst the selected bars. You can select which level values to be displayed in the indicator settings. You can also select the color of the levels thus enabling the trader to be able to attach the indicator several times with differe
    FREE
    AutoPivot
    Hafis Mohamed Yacine
    This indicator will draw monthly, weekly, and daily pivot. Pivot line will be calculated automatically again when the period ends. Auto Pivot Metatrader 4 Indicator The Auto Pivot indicator for Metatrader 4 automatically updates the pivot point (PP), support (S1,S2,S3) and resistance levels (r1,r2,r3) every day. Price above the pivot point means positive while price below the pivot point means negative. S3 indicates extremely oversold while price above resistance r3 means extremely overbought.
    Auto Fibo mq
    DMITRII GRIDASOV
    "Auto FIBO" indicator    - is great auxiliary tool in trading! Indicator automatically calculate and place on chart Fibo levels and local trend lines (red color) Fibonacci levels indicate key areas where price can reverse Most important levels are 23.6%, 38.2%, 50% and 61.8% You can use it   for reversal scalping  or for zone grid trading There are plenty of opportunities to  improve your current system using Auto FIBO indicator as well // More great Expert Advisors and Indicators are availab
    Fibonacci SR Indicator
    Martin Eshleman
    3 (2)
    Fibonacci SR Indicator This indicator creates support and resistance lines. This indicator is based on Fibonacci Retracement and Extension levels. It will consider many combinations of the Fibonacci levels and draw support/resistance lines based on these. This indicator uses tops and bottoms drawn by the ZigZag indicator in its calculations. The ZigZag can also be drawn on the chart, if necessary. The indicator considers many combinations of past reversal points and Fibonacci ratio levels, and
    FREE
    Trend Catcher with Alert
    Issam Kassas
    4.84 (62)
    The Trend Catcher: The Trend Catcher Strategy with Alert Indicator is a versatile technical analysis tool that aids traders in identifying market trends and potential entry and exit points. It features a dynamic Trend Catcher Strategy , adapting to market conditions for a clear visual representation of trend direction. Traders can customize parameters to align with their preferences and risk tolerance. The indicator assists in trend identification, signals potential reversals, serves as a trail
    FREE
    Possible Price reversals levels - based on  Fibonacci + Support +  Resistance Levels Auto levels drawn based on input index (Bars Count )  ---->>> Price Over 50% Fibo line ---> UP TREND ---> BUY when price drop near Support Lines  ---->>> Price Down 50% Fibo line ---> DOWN TREND ---> SELL when price goes up  near Resistance Lines  --->>> The more close price levels ----> the more possibility for price reversals --->>> are you a scalper --> try it on M1 charts with big index like 5000 bars  or
    Leo Fibonacci
    Dmitriy Zaytsev
    The indicator is designed for determining Fibonacci levels. Does not repaint/redraw The blue level shows the zero Fibonacci value (it is also the Pivot level) Red levels show calculated Fibonacci levels (used as a rollback or reversal point) Automatic period detection (periods can be entered manually) Adjustable display calculation method. Settings BarsHistory - the number of bars to be used to display the indicator. Method - method of calculation. AutoPeriod - automated period calculation (true
    Capital Pivot
    Mr Nisit Noijeam
    Pivot Points และระดับ (Support) และ(Resistance) บนแผนภูมิการเทรดใน MetaTrader 4 สำหรับตลาด Forex : คำนวณ Pivot Points : สคริปต์คำนวณจุด Pivot โดยใช้ข้อมูลราคาประวัติศาสตร์ เช่น ราคาเปิด, ราคาสูงสุด, ราคาต่ำสุด, และราคาปิด จากช่วงเวลาที่กำหนด (เช่น วัน, ชั่วโมง, ฯลฯ) จุด Pivot และระดับต่างๆ เช่น R1, R2, R3 (ระดับการต้านทาน) และ S1, S2, S3 (ระดับการสนับสนุน) ถูกคำนวณออกมา แสดงบนแผนภูมิ : หลังจากคำนวณจุด Pivot และระดับต่างๆ, สคริปต์จะแสดงเส้นเหล่านี้บนแผนภูมิ MT4 เพื่อช่วยให้นักเทรดสามารถเห็นจุดที่
    The indicator detects and displays the 5-0 harmonic pattern on the chart according to the scheme provided in the screenshot. The pattern is plotted by the extreme values of the ZigZag indicator (included in the resources, does not require additional installation). After detecting the pattern, the indicator notifies of that by the pop-up window, a mobile notification and an email. The indicator highlights not only the complete figure, but also the time of its formation. During the formation the f
    Strong Retracement Points Pro demo edition! SRP (Strong Retracement/Reversal Points) is a powerful and unique support and resistance indicator. It displays the closest important levels which we expect the price retracement/reversal! If all level are broken from one side, it recalculates and draws new support and resistance levels, so the levels might be valid for several days depending on the market! If you are still hesitating to start using this wonderful tool, you can check this link to see h
    ZigZag Professional
    Dmitriy Kashevich
    5 (1)
    the zigzag indicator draws lines on the chart from the highest point to the lowest There are built-in fibonacci levels built-in sound alert the indicator highlights trends on small timeframes with a thin line and trends highlights with a coarse line Fibonacci levels can be turned on and off in the settings settings are very simple and clear the same sound alert can be turned on and off, you can change the colors of the lines.
    Fibonaccitools
    Aymn Sʿyd Ahmd Hsn Alkwmy
    Fibonacci retracements are popular tools that traders can use to draw support lines, identify resistance levels, place stop-loss orders, and set target prices. A Fibonacci retracement is created by taking two extreme points on a stock chart and dividing the vertical distance by the key Fibonacci ratios of 23.6%, 38.2%, 50%, 61.8%, and 100%. Fibonacci tools indicator will Draw Fibonacci Tools e.g. Retracement, Arc, Fan, Expansion, TimeZones. Based on zigzag indicator"
    Auto AndrewFork
    Noor Ghani Rahman
    1 (1)
    Auto Pitchfork Indicator The indicator calculate the Pitch fork for the previous Day (Selectable) with multiple Support and Resistance lines from the Median price which acts as Magnet for the Price that if price touch the above warning (1) or below warning (1) lines and not cross up or down then there is maximum possibilities that it will return to the Median Line, and thus maintain the Price Action in Cyclic Pattern to the Market Move. You are able to select how many warning lines you want to k
    Pivot Point Multi Method is a fully automatic pivot point indicator and indicate support and resistances (S1,S2,S3,S4,R1,R2,R3,R4) based on four Methods that you can select on of them Pivot point detection and drawing support resistances Methods( Classic ,Camarilla ,Woodie ,Fibonacci) Pivot Point Multi Method is working on all time frames and all currency pairs and gold silver and crypto currencies . Recommended Setting : Pivot_Method    select one of the methods ( Classic ,Camarilla ,Woodi
    Индикатор высчитывается по сложному авторскому алгоритму. Он строится с учетом тенденции по зонам перекупленности перепроданности объёмов . Это позволяет выявлять дивергенцию объёмов , выявить так называемые приседающие бары. Также он определяет уровни входа в рынок и цели. Средняя линия канала является предполагаемым уровнем отката. RPeriod- период расчета индикатора Indicator_Level - уровень зон перекупленности перепроданности Draw Fibo Levels - отображаем целевые уровни Fibo Level Col
    Trend Ray
    Andriy Sydoruk
    The indicator shows the potential trend direction by cyclical-wave dependence. Thus, all the rays of the intersection will be optimal rays, in the direction of which the price is expected to move, taking into account the indicator period. Rays can be used as a direction for potential market movement. But we must not forget that the approach must be comprehensive, the indicator signals require additional information to enter the market.
    Description: The indicator measures, through the zigzag indicator, the levels of trend or correction. It shows in the chart the levels of each low or high detected. KEY LINKS:   How to Install  –  Frequent Questions  -  All Products  How is this indicator useful? This indicator determines, depending on Zigzag parameter if a trend is beginning, developing, or ending This indicator determines the direction of the trend Components Levels as positive or negative numbers, depending on the direction
    FREE
    NO REPAINT ADVANCED CHART PATTERN INDICATOR By definition, a price ( chart)  pattern is a recognizable configuration of price movement that is identified using a series of  trendlines  and/or curves. When a price pattern signals a change in trend direction, it is known as a reversal pattern; a continuation pattern occurs when the trend continues in its existing direction following a brief pause. Advanced Chart Pattern Tracker is designed to find the MOST ACCURATE patterns. A special script is
    This powerful tool combines the Zigzag algorithm with Fibonacci retracement levels, enhancing your trading experience in the MetaTrader 4 (MT4) platform. Zigzag with Fibo Indicator Time Frame :- 1H and above The   Zigzag with Fibo Indicator   is designed to identify trend direction and provide precise entry and exit points for forex trading. Here’s what makes it stand out: Zigzag Algorithm Integration : The indicator utilizes the Zigzag algorithm, which helps filter out market noise and highligh
    FREE
    The indicator detects and displays Shark harmonic pattern (see the screenshot). The pattern is plotted by the extreme values of the ZigZag indicator (included in the resources, no need to install). After detecting the pattern, the indicator notifies of that by a pop-up window, a mobile notification and an email. The indicator highlights the process of the pattern formation and not just the complete pattern. In the former case, it is displayed in the contour triangles. After the pattern is comple
    ZigZag Fibo Retracement
    Dang Khoa Nguyen
    5 (1)
    ZigZag Fibo Retracement Indicator Optimize Your Trading Strategy! Are you seeking to optimize your trading strategy in the financial markets? Explore the unique features of the ZigZag Fibo Retracement Indicator, a powerful tool designed to help you identify potential support and resistance levels based on the combination of ZigZag patterns and Fibonacci ratios. Integration of ZigZag Patterns and Fibonacci: The ZigZag Fibo Retracement Indicator combines the effectiveness of ZigZag patterns, helpi
    FREE
    Average Daily Weekly Monthly Range Alerts. The most complete multi-period dynamic range indicator with full alert options. Visually displays the Average Range lines on chart + real time distances to the Range Highs and Lows. Notifications are sent when the average ranges are hit. An essential tool for any serious trader! Average period ranges, especially the ADR (Average Daily Range) for day traders, are one of the most useful and consistently reliable indicators available to traders. Always a
    FiboZag
    Andriy Sydoruk
    Indicator FiboZag - transfer the indicator to the chart and the Fibonacci levels will be built automatically on the last ZigZag turn. The main advantage lies in the correct construction of Fibonacci levels and markup of price levels. Simple, visual and effective use. The indicator is not redrawn and does not lag. Works on all currency pairs and on all timeframes.
    Market Structure Zig Zag
    Lesedi Oliver Seilane
    4.8 (25)
    Free Market structure zig zag to assist in price action trading the screenshots describe how to use and how to spot patterns new version comes with alerts, email alert and  push notification alert can be used on all pairs  can be used on all timeframes  you can add additional confirmation indicators the indicator shows you your higher high and low highs as well as your lower lows and lower highs  the indication makes price action analysis easier to spot.
    FREE
    PS Wave Crossing MT4
    Miguel Angel Vico Alba
    5 (4)
    Taking into account an efficiency factor and the CCI + RSI + MA, the result is a cross with a high probability rate. Each crossing could be taken as the "Delta" based on the above-mentioned factors. Feel free to adapt it to your liking. This is not an indicator "magical", is one more tool to help confirm signals. Parameters CCI Period RSI Period MA Period Coefficient (0 to 8) Drawing Style Color Main Line Color Signal Line Lines Width (1 to 5) Show arrows crossing Main/Signal Show arrows cros
    The indicator detects and displays 3 Drives harmonic pattern (see the screenshot). The pattern is plotted by the extreme values of the ZigZag indicator (included in the resources, no need to install). After detecting the pattern, the indicator notifies of that by a pop-up window, a mobile notification and an email. The indicator highlights the process of the pattern formation and not just the complete pattern. In the former case, it is displayed in the contour triangles. After the pattern is com
    Candle EA MT4
    Mansour Babasafary
    4.42 (48)
    This expert is based on patterns The main patterns of this specialist are candlestick patterns Detects trends with candlestick patterns It has a profit limit and a loss limit, so it has a low risk The best time frame to use this expert is M30 time frame The best currency pairs to use with this expert is the EURUSD, GBPUSD, AUDUSD, USDCAD currency pairs Attributes: Can be used in the EURUSD, GBPUSD, AUDUSD, USDCAD  currency pairs Can be used in M30, H1, H4 time frames Has profit limit an
    Basic Fibonacci Calculation Indicator  shows Trend, Stoploss, Profit 1,2,3, will show you your daily Highs and your Daily Lows , it will also show you where it expects the price to move to.  best time frame is H1 or higher .  For  a better system that also includes my Non-repaint Indicator please check out my paid Fibo Indicator  https://www.mql5.com/en/market/product/82323
    FREE
    Buyers of this product also purchase
    TPSpro RFI Levels
    Roman Podpora
    4.85 (20)
    Reversal First Impulse levels (RFI)    INSTRUCTIONS        RUS       -       ENG              R ecommended to use with an indicator   -   TREND PRO -  Version MT5 A key element in trading is zones or levels from which decisions to buy or sell a trading instrument are made. Despite attempts by major players to conceal their presence in the market, they inevitably leave traces. Our task was to learn how to identify these traces and interpret them correctly. Main functions: Displaying active zones
    Scalper Inside PRO
    Alexey Minkov
    4.74 (58)
    An exclusive indicator that utilizes an innovative algorithm to swiftly and accurately determine the market trend. The indicator automatically calculates opening, closing, and profit levels, providing detailed trading statistics. With these features, you can choose the most appropriate trading instrument for the current market conditions. Additionally, you can easily integrate your own arrow indicators into Scalper Inside Pro to quickly evaluate their statistics and profitability. Scalper Inside
    Atomic Analyst
    Issam Kassas
    5 (3)
    First of all Its worth emphasizing here that this Trading Indicator is   Non-Repainting , Non Redrawing and Non Lagging Indicator   Indicator, Which makes it ideal from both manual and robot trading.  User manual: settings, inputs and strategy . The Atomic Analyst  is a PA Price Action Indicator that uses Strength and Momentum of the price to find a better edge in the market. Equipped with Advanced filters which help remove noises and false signals, and Increase Trading Potential. Using Multipl
    Currently 20% OFF ! Best Solution for any Newbie or Expert Trader! This dashboard software is working on 28 currency pairs plus one. It is based on 2 of our main indicators (Advanced Currency Strength 28 and Advanced Currency Impulse). It gives a great overview of the entire Forex market plus Gold or 1 indices. It shows Advanced Currency Strength values, currency speed of movement and signals for 28 Forex pairs in all (9) timeframes. Imagine how your trading will improve when you can watch the e
    Enigmera
    Ivan Stefanov
    5 (3)
    ENIGMERA: The core of the market (If the demo of mql5.com doesn't working and you want to try Enigmera please message me.) Introduction This indicator and trading system is a remarkable approach to the financial markets . ENIGMERA uses the fractal cycles to accurately calculate support and resistance levels. It shows the authentic accumulation phase and gives direction and targets.  A system that works whether we are in a trend or a correction.   How does it operate? ENIGMERA comprises of fol
    Gold Stuff
    Vasiliy Strukov
    4.89 (262)
    Gold Stuff is a trend indicator designed specifically for gold and can also be used on any financial instrument. The indicator does not redraw and does not lag. Recommended time frame H1. At it indicator work full auto  Expert Advisor EA Gold Stuff. You can find it at my profile. Contact me immediately after the purchase to get   personal bonus!  You can get a free copy of our Strong Support and Trend Scanner indicator, please pm. me! Settings  and manual here   SETTINGS Draw Arrow - on off. dra
    TPSproTREND PrO
    Roman Podpora
    4.78 (18)
    TPSpro TRENDPRO  - is a trend indicator that automatically analyzes the market and provides information about the trend and each of its changes, as well as giving signals for entering trades without redrawing! The indicator uses each candle, analyzing them separately. referring to different impulses - up or down impulse. Exact entry points into transactions for currencies, crypto, metals, stocks, indices!  -  Version MT5               DETAILED DESCRIPTION                R ecommended to use with
    Introducing   Quantum Trend Sniper Indicator , the groundbreaking MQL5 Indicator that's transforming the way you identify and trade trend reversals! Developed by a team of experienced traders with trading experience of over 13 years,   Quantum Trend Sniper Indicator   is designed to propel your trading journey to new heights with its innovative way of identifying trend reversals with extremely high accuracy. ***Buy Quantum Trend Sniper Indicator and you could get Quantum Breakout Indicator fo
    FX Volume
    Daniel Stein
    4.6 (35)
    Visit our all-new   Stein Investments Welcome Page   to get the latest information, updates and trading strategies. FX Volume is the FIRST and ONLY volume indicator that provides a REAL insight into the market sentiment from a broker's point of view. It provides awesome insights into how institutional market participants, like brokers, are positioned in the Forex market, much faster than COT reports. Seeing this information directly on your chart is the real game-changer and breakthrough solut
    Quantum Breakout Indicator PRO
    Bogdan Ion Puscasu
    4.96 (26)
    Introducing   Quantum Breakout PRO , the groundbreaking MQL5 Indicator that's transforming the way you trade Breakout Zones! Developed by a team of experienced traders with trading experience of over 13 years, Quantum Breakout PRO is designed to propel your trading journey to new heights with its innovative and dynamic breakout zone strategy. Quantum Breakout Indicator will give you signal arrows on breakout zones with 5 profit target zones and stop loss suggestion based on the breakout box.
    norepaint buy sell indicator is norepaint indicator.and works all pairs and all timeframes. using is wery simple ,it puts arrow on price probably buy sell arrows. thise indicator is suitable for beginner and experienced traders. there is cnt numbers that show how many bars you see the signal back. increasing it possible but up to chart have the how many bars . minimum value of this 500.
    Gann Signal
    Kirill Borovskii
    Gann Signal is a very simple indicator at first glance, but hidden inside is many years of experience in studying W.D.Ganna methods. The indicator gives accurate BUY/SELL signals, without redrawing. The indicator is very easy to use. All you need to do is attach it to your chart and follow its recommendations. The indicator constantly analyzes the market for entry opportunities. When such an opportunity appears, the indicator gives a signal in the form of an arrow. I repeat, all signals are NOT
    Cycle Sniper
    Elmira Memish
    4.39 (36)
    NEW YEAR SALE PRICE FOR LIMITED TIME!!! Please contact us after your purchase and we will send you the complimentary indicators to complete the system Cycle Sniper is not a holy grail but when you use it in a system which is explained in the videos, you will feel the difference. If you are not willing to focus on the charts designed with Cycle Sniper and other free tools we provide, we recommend not buying this indicator. We recommend watching the videos about the indiactor and system before pu
    Gold Channel is a volatility-based indicator, developed with a specific timing algorithm for the XAUUSD pair, which consists of finding possible corrections in the market. This indicator shows two outer lines, an inner line (retracement line) and an arrow sign, where the theory of the channel is to help identify overbought and oversold conditions in the market. The market price will generally fall between the boundaries of the channel. If prices touch or move outside the channel it is a tra
    Please send me Direct message on MQL5 CHAT after purchasing the Indicator for Training and Installation Support There are some additional files that is important to use with the Indicator . So be sure to contact me after purchasing the Indicator So that I can add you for training and support . If you find any difficulty with installation then send me Direct message here So that I can connect with you via Anydesk or Teamview for the product installation. " Smart Order Block Indicator " to find
    Up down v6T
    Guner Koca
    5 (1)
    Thise indicator is up down v6  comes with tradingwiev pinescript. purchased people, after installed on terminal ,contact me on mql5  to get BONUS  TradingView pinescript. up-down indicator is no repaint and works all pairs and lower than weekly time frames charts. it is suitable also 1 m charts for all pairs. and hold long way to signal. dont gives too many signals. when red histogram cross trigger line that is up signal.and price probably will down when blue histogram cross trigger line that
    Currency Strength Exotics
    Bernhard Schweigert
    4.88 (33)
    CURRENTLY 20% OFF ! Best Solution for any Newbie or Expert Trader! This Indicator is specialized to show currency strength for any symbols like Exotic Pairs Commodities, Indexes or Futures. Is first of its kind, any symbol can be added to the 9th line to show true currency strength of Gold, Silver, Oil, DAX, US30, MXN, TRY, CNH etc. This is a unique, high quality and affordable trading tool because we have incorporated a number of proprietary features and a new formula. Imagine how your trading
    TrendMaestro
    Stefano Frisetti
    5 (3)
    note: this indicator is for METATRADER4, if you want the version for METATRADER5 this is the link:  https://www.mql5.com/it/market/product/108106 TRENDMAESTRO ver 2.4 TRENDMAESTRO recognizes a new TREND in the bud, he never makes mistakes. The certainty of identifying a new TREND is priceless. DESCRIPTION TRENDMAESTRO identifies a new TREND in the bud, this indicator examines the volatility, volumes and momentum to identify the moment in which there is an explosion of one or more of these data a
    Introduction to Fractal Pattern Scanner Fractal Indicator refers to the technical indicator that makes use of the fractal geometry found in the financial market. Fractal Pattern Scanner is the advanced Fractal Indicator that brings the latest trading technology after the extensive research and development work in the fractal geometry in the financial market. The most important feature in Fractal Pattern Scanner is the ability to measure the turning point probability as well as the trend probabi
    GOLD Impulse with Alert
    Bernhard Schweigert
    4.56 (9)
    This indicator is a super combination of our 2 products  Advanced Currency IMPULSE with ALERT  and  Currency Strength Exotics . It works for all time frames and shows graphically impulse of strength or weakness for the 8 main currencies plus one Symbol! This Indicator is specialized to show currency strength acceleration for any symbols like Gold, Exotic Pairs, Commodities, Indexes or Futures. Is first of its kind, any symbol can be added to the 9th line to show  true currency strength accelerat
    System Trend Pro
    Aleksandr Makarov
    System Trend Pro - This is the best trend trading indicator!!! The indicator no repaint!!!   The indicator has   MTF   mode, which adds confidence to trading on the trend (   no repaint   ). How to trade? Everything is very simple, we wait for the first signal (big arrow), then wait for the second signal (small arrow) and enter the market in the direction of the arrow. (See screens 1 and 2.) Exit on the opposite signal or take 20-30 pips, close half of it, and keep the rest until the oppo
    ON Trade Optuma Astro
    Abdullah Alrai
    5 (4)
    This is an astronomy indicator for the MT4 platform like optuma program that performs a variety of functions. It uses complex algorithms to perform its own calculations, which are so accurate. The indicator has a panel that provides astronomical information such as planets' geo/heliocentric cords, distance of sun/earth, magnitude, elongation, constellation, ecliptic cords, equatorial cords, and horizontal cords depending on  the vertical line that generated by the indicator depend on the time va
    Ace Supply Demand Zone Indicator The concept of supply demand relies on the quantity mismatching between buying and selling volumes in the financial market. Supply and demand zone can provide the good entry and exit. A zone is easier to trade than a line. The supply demand zone can provide the detailed trading plan and the risk management. Its ability to predict market direction is high. There are two distinctive points about Ace Supply Demand Zone Indicator. Ace Supply Demand Zone indicator was
    Beast Super Signal
    Dustin Vlok
    4.76 (101)
    Limited special now on! Was $249, now only $179!  Looking for a powerful forex trading indicator that can help you identify profitable trading opportunities with ease? Look no further than the Beast Super Signal.  This easy-to-use trend-based indicator continuously monitors the market conditions, searching for new developing trends or jumping in on existing ones. The Beast Super Signal gives a buy or sell signal when all internal strategies align and are in 100% confluence with each other,
    Tradeable Changer Indie
    Opengates Success International
    Tradeable Changer Indie Trade-able Changer Indie is an indicator that serves several purposes. The idea behind this operating indicator is to have a minimal set of indicator or experts on the chart in order to avoid clumsy chart window and at the same time have a great time trading profitably. This is a combination of Symbol/Time-frame Changer and a Trading system based on Trends following. It has a small board to display trade signals for the trader. Due to the nature of these com
    Volatility Trend System - a trading system that gives signals for entries. The volatility system gives linear and point signals in the direction of the trend, as well as signals to exit it, without redrawing and delays. The trend indicator monitors the direction of the medium-term trend, shows the direction and its change. The signal indicator is based on changes in volatility and shows market entries. The indicator is equipped with several types of alerts. Can be applied to various trading
    NAM Order Blocks
    NAM TECH GROUP, CORP.
    5 (1)
    MT4 Multi-timeframe Order Blocks detection indicator. Features - Fully customizable on chart control panel, provides complete interaction. - Hide and show control panel wherever you want. - Detect OBs on multiple timeframes. - Select OBs quantity to display. - Different OBs user interface. - Different filters on OBs. - OB proximity alert. - ADR High and Low lines. - Notification service (Screen alerts | Push notifications). Summary Order block is a market behavior that indicates order collection
    Indicator : RealValueIndicator Description : RealValueIndicator is a powerful tool designed specifically for trading on the EURUSD pair. This indicator analyzes all EUR and USD pairs, calculates their real currency strength values, and displays them as a single realistic value to give you a head start on price. This indicator will tell you moves before they happen if you use it right. RealValueIndicator allows you to get a quick and accurate overview of the EURUSD currency pair tops and bottoms,
    Entry Points Pro
    Yury Orlov
    4.7 (225)
    Top indicator for MT4 providing accurate signals to enter a trade without repainting! Watch  the video  (6:22) with an example of processing only one signal that paid off the indicator! It can be applied to any financial assets:  forex, cryptocurrencies, metals, stocks, indices.  MT5 version is here   It will provide pretty accurate trading signals and tell you when it's best to open a trade and close it. Most traders improve their trading results during the first trading week with the help of t
    Introduction to Fibonacci Volatility Indicator Volatility indicator can help you to detect any statistical advantage for your trading. Especially, if you are trading with Price Action and Price Patterns, then we recommend to use the Volatility indicator together with your strategy. Especically, Fibonacci Volatility indicator combines the market volatiltiy with Fibonacci Analysis to provide you more advanced volatiltiy indicator. Main Features Fibonacci Volatility in Z score Configuration Mode Fi
    More from author
    TradePad
    Ruslan Khasanov
    5 (2)
    The simple solution for quickly trading operations and controlling positions on multiple trading symbols. The panel interface is simple and intuitive. For comfortable work, the trader is offered a set of tools: the hotkey manager to help you manage all trade operations and chart timeframes; a tool for marking trading levels when placing pending or market orders to assess risks and potential profits when setting Stop Loss/Take Profit levels; built-in MultiCharts indicator for monitoring multiple
    MultiCharts MT5
    Ruslan Khasanov
    5 (1)
    This is a multi-currency monitoring panel that shows charts of selected symbols in a separate window. It allows traders to visually analyze price movements on various symbols and periods, as well as quickly switch between them. A demo version is available on the TradePad product description page:    https://www.mql5.com/en/blogs/post/751207 Included in another utility for fast trading - TradePad Parameters Indicator UID - unique ID. Each launched copy should have its own ID; to open a chart in t
    Quick Info
    Ruslan Khasanov
    Quick Info   - information utility for collecting and providing a trader with various useful information needed in trading on financial markets every day. All the necessary information is collected and grouped in a separate window. On the first tab, you will find trade statistics for the selected time period. To collect trade statistics, you just need to select a time period from the list or specify the start and end dates of the period for which you want to show trade statistics. You can also v
    Candle hunter
    Ruslan Khasanov
    5 (1)
    Indicator for graphical analysis. Marks the main Japanese candlestick patterns on the chart. At the moment, the following set of patterns is available to the trader:  - Bearish/Bullish Abandoned Baby;  - Bearish Advance Block;  - Bearish Deliberation;  - Bearish/Bullish Belt Hold;  - Bearish/Bullish Engulfing;  - Bearish Shooting Star;  - Bearish Evening Star;  - Bearish Evening Doji Star;  - Bearish/Bullish Doji Star;    - Bearish/Bullish Tri-Star;  - Bearish Hanging Man;  - Bearish/Bullish Ha
    Filter:
    4example
    245
    4example 2021.03.07 13:11 
     

    Wonderful indicator. Your can see at a glance what a pair is doing and have everything in one chart. More over, the indicator has alerts and you can add moving averages of your choice to it. So now I can receive alerts from all pairs since I have only one profile active. It is basically a scanner with multi time frames enabled. The developer answers really fast and is offering advice on how to twick and have it the way you desire. Not many developers doing this with their product. What took me before several minutes, now it is a breeze. I have one chart with all pairs open on daily. This way I can see at a glance what the main trend is doing. Another one with 1 hour alerts on all pairs I consider worth trading. ... WONDERFUL work. Thank you.

    Iqbal Aroussi
    114
    Iqbal Aroussi 2020.05.10 15:43 
     

    A very good tool to visualize and analyze several trading symbols quickly. Without the need of having multiple monitors.

    Very useful when you're on the move, like traveling or simply not at your trading desk, working from your laptop.

    I contacted the Dev Ruslan a Sunday morning for an issue regarding the indicator not working on my Linux MT4 installation. I was amazed that he fixed quickly and uploaded the new version to Market Place within the hour that we chatted.

    I'm a happy buyer of the full version, really worth it.

    Iqbal

    Reply to review
    Version 23.1 2023.03.27
    The new version contains numerous changes and improvements.
    Version 22.12 2022.12.08
    Bugs fixed. Improved performance. Updated collection of trend indicators.
    Version 21.3 2021.03.16
    Added notifications when moving averages cross.
    Added a new parameter in the indicator settings - Allowed pairs for Notifications. List of symbols for which notifications are allowed. Specify, separated by a space, pairs on which notifications are allowed, for example: EURUSD, M5 GBPUSD, H1 USDJPY, M15
    If the parameter is left blank, then notifications will be allowed for all pairs specified in the indicator settings.
    Version 20.5 2020.05.10
    Fixed a bug for currency pairs that have suffixes/prefixes in their names