Adaptive RSI
- Indicators
- Rasoul Mojtahedzadeh
- Version: 3.22
- Updated: 23 March 2020
- Activations: 10
Relative Strength Index (RSI) is one of the most popular and accurate oscillators widely used by traders to capture overbought and oversold areas of price action. Although the RSI indicator works fine for a period of market, it fails to generate profitable signals when market condition changes, and hence produces wrong signals which results in big losses.
Have you ever thought about an adaptive RSI indicator that adapts its period of calculation based on the market conditions? The presented indicator implements an optimization algorithm which identifies the best period for calculation of RSI based on maximization of the profit over N-past bars. You can imagine that the optimization process of the strategy tester of MetaTrader is continuously running on live charts to find the best RSI period, based on which the profit of trading on the RSI signals will be maximized. The values of this indicator, similar to that of the RSI indicator, are shown between 0 and 100.
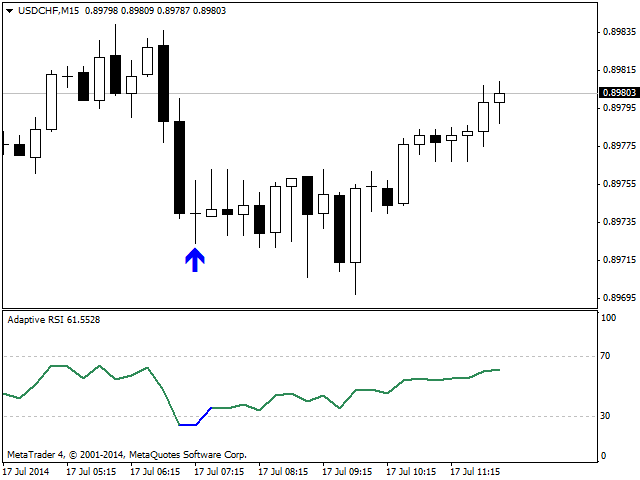
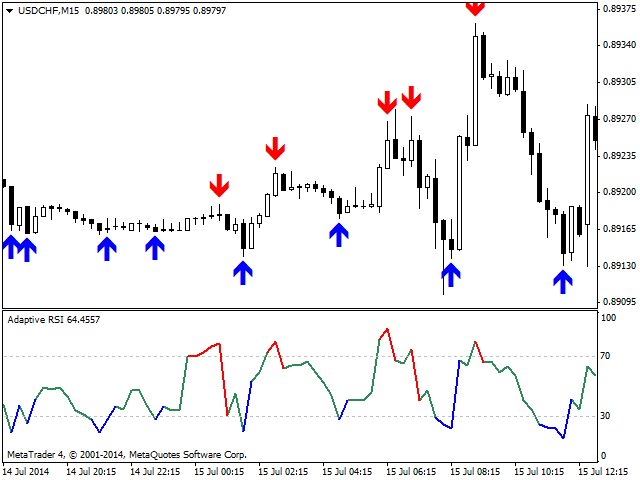
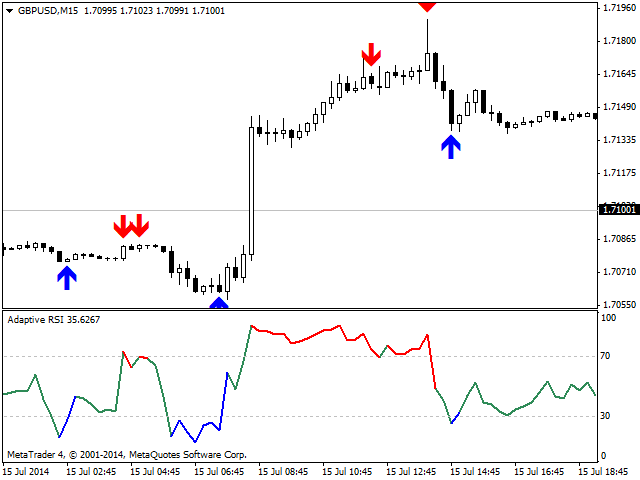
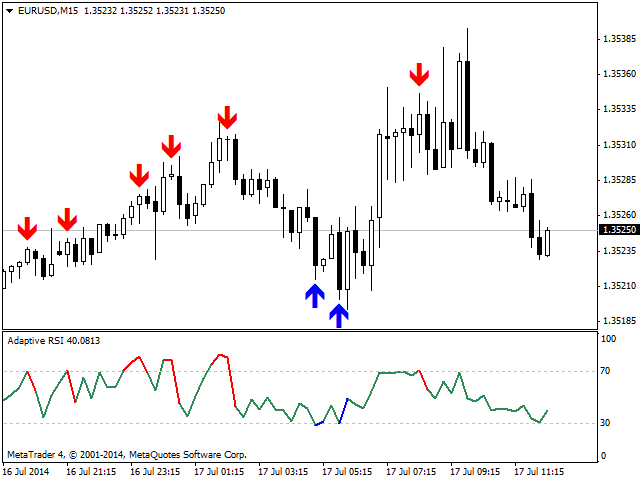
- An RSI value falling into the 70 - 100 region of the scale is regarded as being overbought (i.e., it is the most probable time to open a short position).
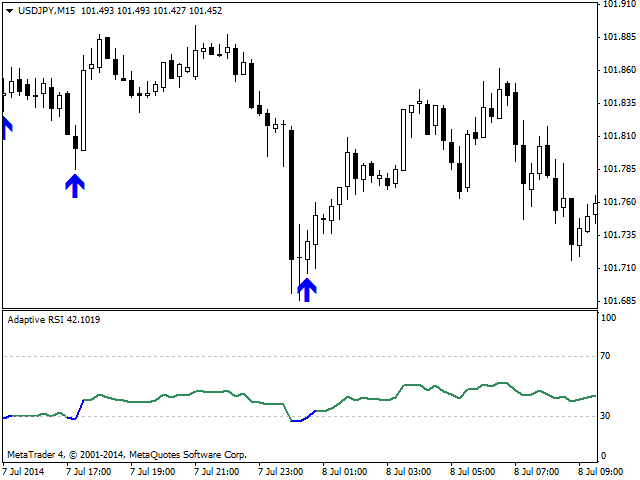
- An RSI value falling within the 0 to 30 region is considered oversold (i.e., it is most probable time to open a long position).
Features
- Automatically determines the best period of RSI to adapt to the current market conditions.
- Identifies overbought and oversold areas more accurately than original RSI indicator.
- Shows BUY/SELL signal arrows on the bar chart. (must be enabled in the input settings of the indicator)
- Generates alerts for the signals.
- Highlights overbought and oversold areas with different colors for easier recognition.
- Generates reliable BUY/SELL signals on oversold/overbought areas.
- Works with 4 and 5 digits brokers.
- Maximum Bars to Look Back: A positive integer number that indicates the maximum past bars, over which the adaptive RSI values will be computed.
- Maximum Past Bars for Optimization: A positive integer number that indicates the maximum past bars, over which optimization (to find the best RSI period) will be performed.
- Minimum RSI Period for Optimization: A positive integer number (greater than zero) that indicates the minimum RSI period to take into account in the optimization.
- Maximum RSI Period for Optimization: A positive integer number that indicates the maximum RSI period to take into account in the optimization.
- RSI Period Step for Optimization: A positive integer number (greater than zero) that indicates the incremental step of RSI period to take into account in the optimization.
- Alert Enable/Disable: if true, the alerts will be triggered for the BUY/SELL signals.
- Email Notification?: If it sets to true, when a pattern is recognized, an email will be sent to the address set in the options of MetaTrader 4.
- Mobile Notification?: If it sets to true, when a pattern is recognized, the user will receive a push notification on his/her mobile phone.
- Show Signal Arrows?: if true, BUY/SELL arrows will be shown on the bar chart.
- Overbought Color: The color for highlighting overbought areas.
- Oversold Color: The color for highlighting oversold areas.
- Overbought & Oversold Line Width: Thickness of line for highlighting overbought and oversold areas.
- Applied Price: Applied price type for calculating RSI (default is Close).
- Show Current RSI Period: If true, it displays the current optimized value of RSI period.








nice work