P S Technical Tradingbot
- Experts
- Trader-09 Schumacher
- Version: 1.0
- Activations: 5
The underlying P.S.-Technical Trading bot is a computer program written in the MQL5 language. The P.S.-Technical Trading bot is a fully
automated trading robot based on the two developed technical indicators, ADX and Parabolic SAR, developed by technical analyst Welles
Wilder Jr.
If you want to learn more about this, I recommend the book "New Concepts in Technical Trading Systems" which was
published in 1978.
In addition, the trading bot eliminates all too understandable emotions during trading.
Following a few quotes from Welles Wilder Jr.:
1. "Letting
your emotions override your plan or system is the biggest cause of failure."
2."Some traders are born with an innate discipline. Most have to learn it the hard way."
3."If you can't deal with emotion, get out of trading."
All these problems are taken care of by the trading robot.
Product description:
The P.S.-Technical trading bot is based on a strategy developed by technical analyst Welles
Wilder Jr. The P.S.-Technical Trading bot works with two indicators, the ADX and the Parabolic SAR.
Fully automatic trading 24/5. The
EA works around the clock, fully automatic.
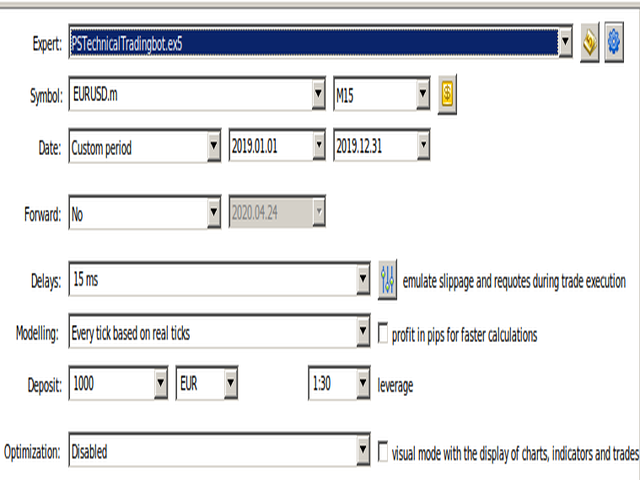
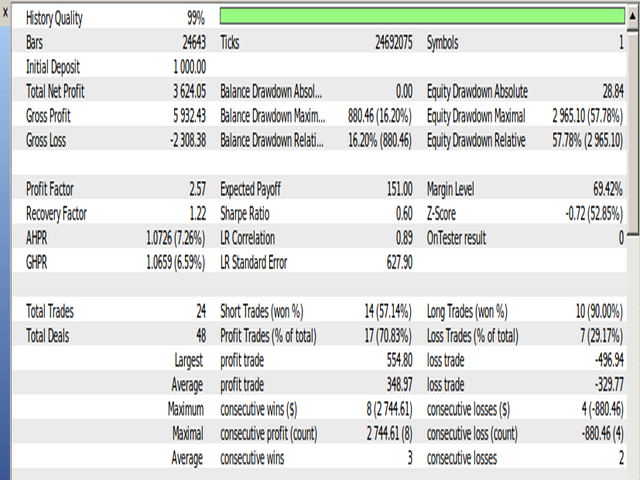
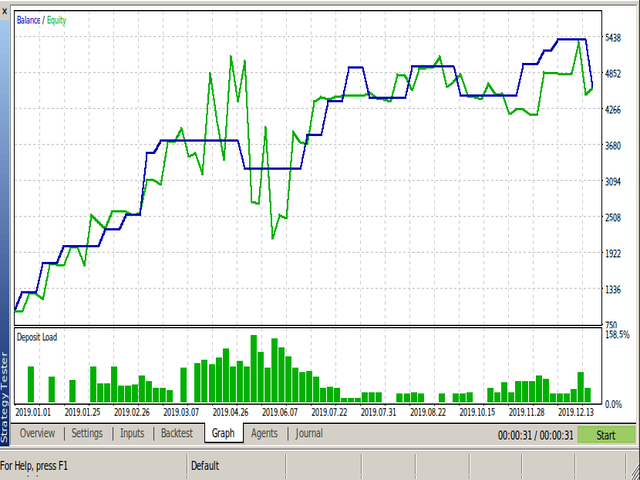
The P.S.-Technical trading bot was optimized once with real ticks with a modeling quality
of 99.99 %.
Does not require a large initial deposit (1000 € or less sufficient)
Important: The recommended default
setting is for EUR/USD M15. So if possible make sure you use the 15 min chart. The 10 min or 5 min chart would theoretically also be possible, but
better trends can be derived mathematically from a longer chart duration, with which the P.S.-Technical tradingbot tends to work better.
The delay of a VPS server or virtual hosting should not exceed 15 ms.
How it works:
The P.S.-Technical trading bot uses the ADX indicator and the Parabolic SAR indicator to open a long position
or a short position based on these trading signals.
The two indicators are used as an entry signal for opening a trade and determine
when the trading bid opens a long position or a short position.
Explanation of the ADX indicator: The ADX measures trend strength.
It therefore provides information on whether bulls or bears dominate a market. If the ADX is over 20, for example, then you usually have a
trend. If the ADX, for example, has a value above 20 and there is now a crossing between the two lines DI+ and DI-, then this crossing has a force
and indicates a possible upward trend.
If, for example, the ADX is over 20 and a crossing of the two lines D+ and D- takes place, this
means an entry signal for the P.S.-Technical tradingbot. The first and the second parabolic SAR indicator points is also taken into account
if it is below (bullish signal) or above (bearish signal) the candle. A buy position is only opened if both signals match, i.e. if, for
example, there is a crossing between the lines D+ and D- and the SAR Parabolic indicator appears under the candle. Conversely, the same
applies except that the P.S.-Technical trading bot opens a sell position in this case.
The P.S.-Technical trading bot therefore
pays attention to a crossing between D+ and D- and D- and D+, if the ADX indicator is above your set value, and it also uses the signal of the
Parabolic SAR indicator to strongly minimize false signals or sideways trends.
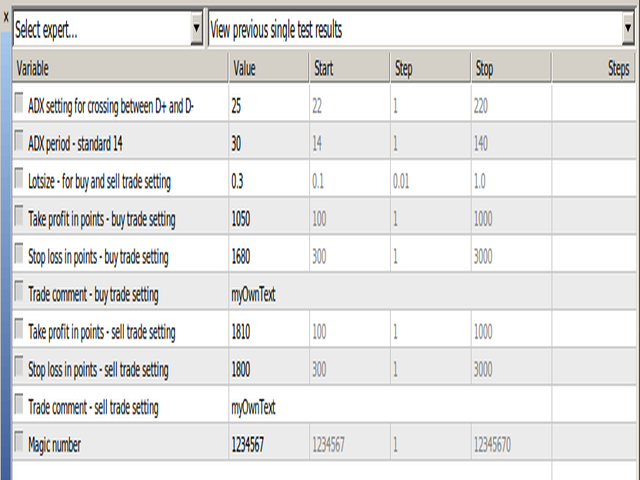
The P.S.-technical tradingbot is fully automated and the user can change the following input parameters:
- ADX value setting used as threshold value for trends
- ADX period setting
- Adjustable lot size - a quantity that the EA will trade
- Take Profit - in points for buy trade setting
- Stop Loss - in points for buy setting
- Trade comment buy trade setting
- Take Profit - in points for sell trade setting
- Stop Loss - in points for sell setting
- Trade comment sell setting
- EA Magic Number - used for trade identification
The money management is completely automated and you don't have to worry about anything after the first setup. Hint: use ADX period 27.
The P.S.-Technical trading bot is designed for both professionals and beginners. Furthermore, the chart of the asset is checked for the trading strategy and takes the trading decision away from you within seconds. You gain a lot of free time because you don't have to sit in front of the monitor all the time waiting for a favorable entry signal.
Please feel free to contact me if you have any further questions.
Best regards
Paul

