SuperTrend Plus
- Indicators
- Jonathan Destailleur
- Version: 1.0
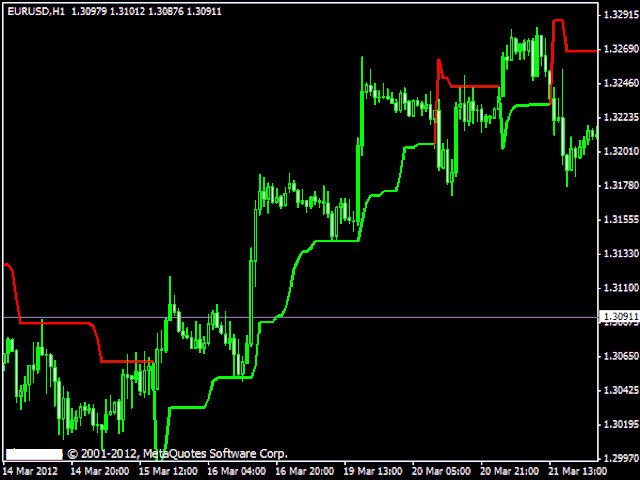
The Supertrend draws a line following the current trend..
- Green Line under the candle means a likely bullish trend
- Red Line above the candle means a likely bearish trend
How to trade with SuperTrend indicator
Buy when the Supertrend Green line is below the price, Sell when the Supertrend Red line is above the price. It is strongly suggested to use this indicator in a trending market.
Parameters
- Multiplier - the lower it is and the more sensitive is the line, meaning it will follow the price more closely
- Period - Period of the ATR used for the calculation
If you like this tool please take a minute to leave a review.











Хороший индикатор! Спасибо!