• Overview
  • Reviews
  • Comments (16)
  • What's new

PZ ABCD Retracement MT5

Identify precise entry and exit points with AB=CD patterns

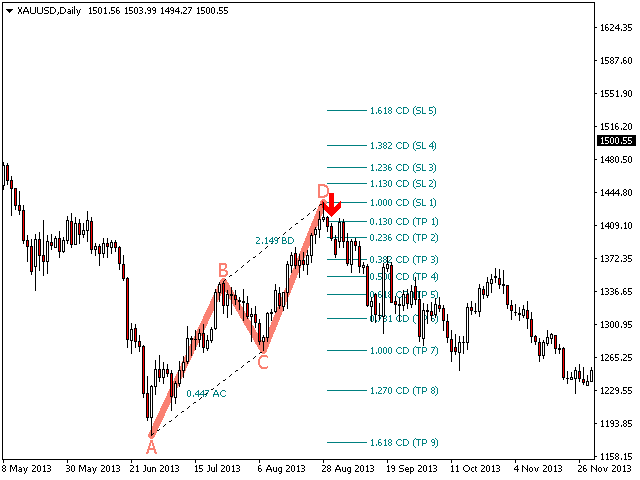
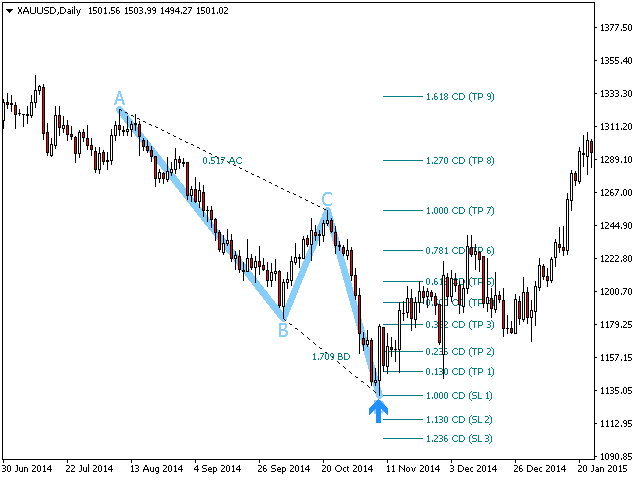
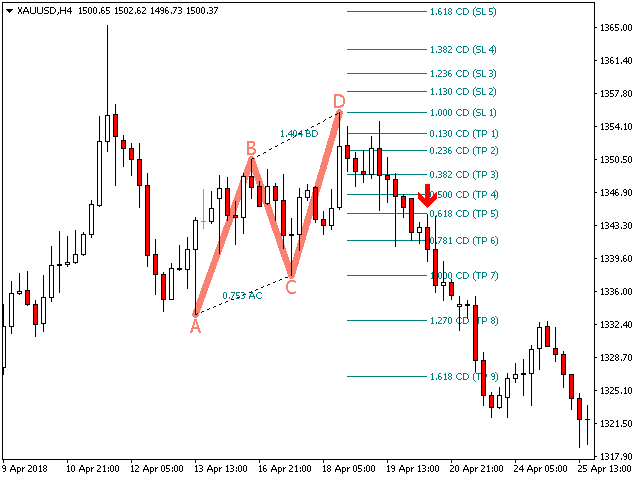
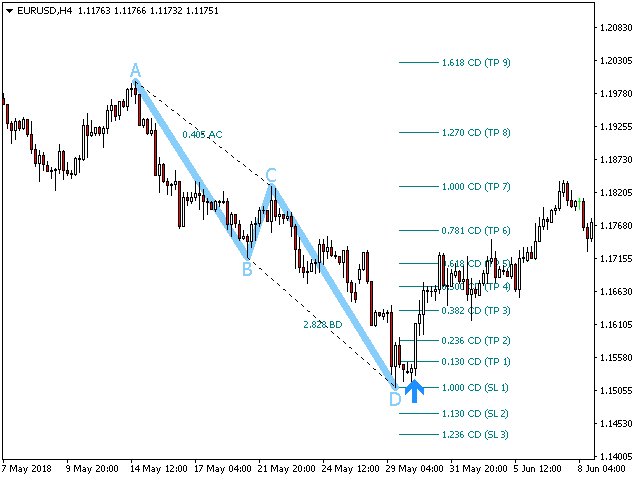
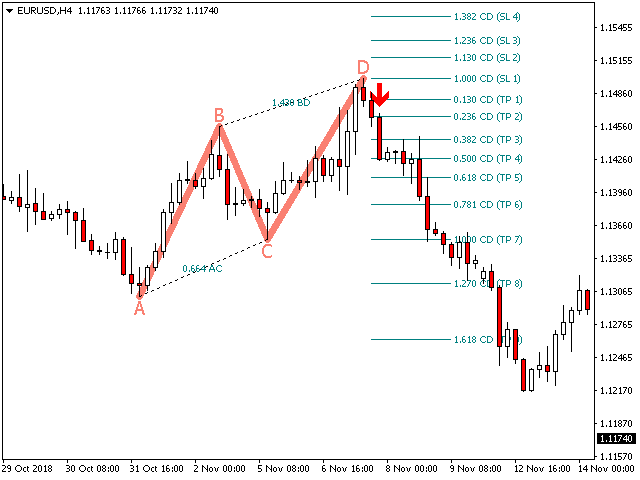
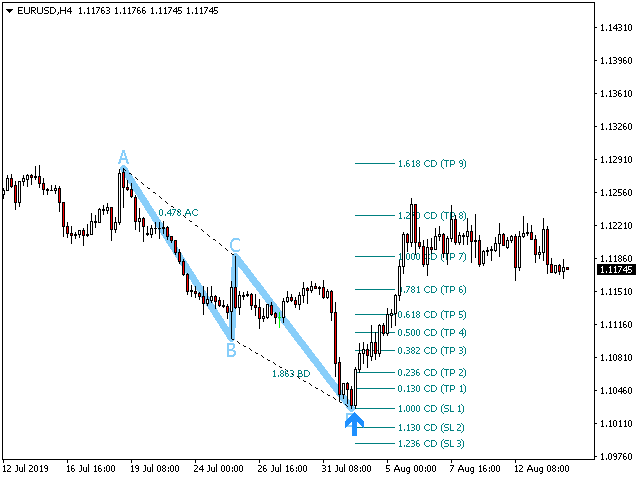
This indicator finds AB=CD retracement patterns. The AB=CD Retracement pattern is a 4-point price structure where the initial price segment is partially retraced and followed by an equidistant move from the completion of the pullback, and is the basic foundation for all harmonic patterns.

[ Installation Guide | Update Guide | Troubleshooting | FAQ | All Products ]

  • Customizable pattern sizes
  • Customizable AC and BD ratios
  • Customizable breakout periods
  • Customizable lines, colors and sizes
  • It displays SL and TP levels based on CD fibo levels
  • Visual/sound/push/mail alerts for patterns and breakouts

AB=CD Retracements can expand and repaint quite a bit. To make things easier this indicator implements a twist: it waits for a donchian breakout in the right direction before signaling the trade. The end result is an otherwise repainting indicator with a very reliable trading signal. The donchian breakout period is entered as an input.

  • Bullish retracements are blue
  • Bearish retracements are red
Kindly note that price patterns such as AB=CD can expand and the indicator must repaint to follow the expansion of the pattern. If the pattern repaints beyond the AC/BD/AB=CD ratios entered in the parameters, the pattern will dissapear as it won't be valid any more. To trade these patterns, please resort to the donchian breakout signal.

Input Parameters

  • Amplitude: Size of the AB=CD patterns to be found
  • Breakout Period: Donchian breakout period to time signals
  • Max History Bars: Amount of bars to look back when the indicator loads
  • Min AC: Minimum AC ratio of the pattern
  • Max AC: Maximum AC ratio of the pattern
  • Min BD: Minimum BD ratio of the pattern
  • Max BD: Maximum BD ratio of the pattern
  • AB = CD: Enable or disable the AB = CD condition
  • Display Options: Display or hide labels, ratios and SL/TP levels
  • Patterns: Select colors and sizes for the lines forming the pattern
  • Labels: Select colors and sizes of the A,B,C,D labels
  • Ratios and SL: Select colors and font-size for ratios and SL/TP labels
  • Alert on breakouts: Enable to receive alerts when a pattern is found
  • Alert on patterns: Enable to receive alerts when a breakout happens and arrows show up
  • Alert settings: Enable or disable visual, push, email and sound alerts


Technical Details

  • The indicator is evaluated every bar, not every tick.
  • The last point of the pattern repaints as the pattern expands.
  • You can have several indicators on the chart with different amplitudes.
  • An alert is displayed when the pattern forms and also when the breakout takes place.
  • A small percentage of trading signals can repaint. You can increase the breakout period.


Author

Arturo López Pérez, private investor and speculator, software engineer and founder of Point Zero Trading Solutions.

Recommended products
ATrend
Zaha Feiz
4.77 (13)
ATREND: How It Works and How to Use It How It Works The " ATREND " indicator for the MT5 platform is designed to provide traders with robust buy and sell signals by utilizing a combination of technical analysis methodologies. This indicator primarily leverages the Average True Range (ATR) for volatility measurement, alongside trend detection algorithms to identify potential market movements. Leave a massage after purchase and receive a special bonus gift. Key Features: ⦁ Dynamic Trend Detect
Noize Absorption Index - is the manual trading system that measures the difference of pressure between bears forces and bulls forces. Green line - is a noize free index that showing curent situation. Zero value of index shows totally choppy/flat market.Values above zero level shows how powerfull bullish wave is and values below zero measures bearish forces.Up arrow appears on bearish market when it's ready to reverse, dn arrow appears on weak bullish market, as a result of reverse expectation.
Owl Smart Levels MT5
Sergey Ermolov
4.07 (28)
MT4 version  |   FAQ The Owl Smart Levels Indicator is a complete trading system within the one indicator that includes such popular market analysis tools as Bill Williams' advanced fractals , Valable ZigZag which builds the correct wave structure of the market, and Fibonacci levels which mark the exact levels of entry into the market and places to take profits. Detailed description of the strategy Instructions for working with the indicator Advisor-assistant in trading Owl Helper Private User
Atomic Analyst MT5
Issam Kassas
4.32 (19)
First of all Its worth emphasizing here that this Trading Indicator is   Non-Repainting   , Non Redrawing and Non Lagging Indicator   Indicator, Which makes it ideal from both manual and robot trading.  User manual: settings, inputs and strategy . The Atomic Analyst  is a PA Price Action Indicator that uses Strength and Momentum of the price to find a better edge in the market. Equipped with Advanced filters which help remove noises and false signals, and Increase Trading Potential. Using Multi
Double HMA MTF for MT5
Pavel Zamoshnikov
4 (4)
This is an advanced multi-timeframe version of the popular Hull Moving Average (HMA) Features Two lines of the Hull indicator of different timeframes on the same chart. The HMA line of the higher timeframe defines the trend, and the HMA line of the current timeframe defines the short-term price movements. A graphical panel with HMA indicator data from all timeframes at the same time . If the HMA switched its direction on any timeframe, the panel displays a question or exclamation mark with a tex
STRICTLY FOR BOOM INDEX ONLY!!!!! Here I bring the Maximum Trend Arrows OT1.0 MT5 indicator. This indicator is made up of a combination of different trend indicators for entries and exits, for entries an orange arrow will paint on the chart below the current market and a red flag for closing of trades and it produces buy arrows only. When the orange arrow appears, it will appear along with it's sound to notify you. The 1H timeframe is recommended, don't use it anywhere else than on the 1H timefr
SolarTrade Suite Financial Indicator: Jupiter Market Indicator - Your Reliable Guide in the World of Financial Markets! This is a trend indicator that uses special innovative and advanced algorithms to calculate its value, and also has an eye-pleasing design. It is very easy to understand the readings of this indicator: blue color - buy, red - sell. Check out our other products from the SolarTrade Suite series at the bottom of the description. Do you want to confidently navigate the world o
How to use Pair Trading Station Pair Trading Station is recommended for H1 time frame and you can use it for any currency pairs. To generate buy and sell signal, follow few steps below to apply Pair Trading Station to your MetaTrader terminal. When you load Pair Trading Station on your chart, Pair Trading station will assess available historical data in your MetaTrader platforms for each currency pair. On your chart, the amount of historical data available will be displayed for each currency pai
Wave Trend MT5
Diego Arribas Lopez
MT4 Version Wave Trend MT5 Wave Trend is an oscillator, which helps identifing in a extremely accurate manner market reversals. The Oscillator being obove the overbought level and a cross down of the fast into the slow MA usually indicates a good SELL signal. If the oscillators is below the oversold level and the fast MA crosses over the slower MA usually highlights a good BUY signal. The Wave Trend indicator can be also used when divergences appear against the price, indicating the current move
The Penta-O is a 6-point retracement harmonacci pattern which usually precedes big market movements. Penta-O patterns can expand and repaint quite a bit. To make things easier this indicator implements a twist: it waits for a donchian breakout in the right direction before signaling the trade. The end result is an otherwise repainting indicator with a very reliable trading signal. The donchian breakout period is entered as an input. [ Installation Guide | Update Guide | Troubleshooting | FAQ | A
Rainbow EA MT5
Jamal El Alama
Description : Rainbow EA MT5 is a simple Expert advisor based on   Rainbow MT5 indicator witch is based on Moving average with period 34. The indicator is incorporated in the EA, therefore, it is not required for the EA to operate, but if you wish, you can download it from   my product page . The Expert Advisor settings are as follows : Suitable for Timeframes up to H1 The parameters below can be set according to your trading rules. StopLoss ( Stop Loss in pips) TakeProfit ( Take Profit in pips
PZ Trend Trading MT5
PZ TRADING SLU
3.8 (5)
Capture every opportunity: your go-to indicator for profitable trend trading Trend Trading is an indicator designed to profit as much as possible from trends taking place in the market, by timing pullbacks and breakouts. It finds trading opportunities by analyzing what the price is doing during established trends. [ Installation Guide | Update Guide | Troubleshooting | FAQ | All Products ] Trade financial markets with confidence and efficiency Profit from established trends without getting whip
Banana Binary MT5 Signal
Nirundorn Promphao
1 (1)
Promotion $66 lifetime for you. The principle of this indicator is very simple: detecting the trend with Moving Average, then monitoring the return point of graph by using the crossing of Stochastic Oscillator and finally predicting BUY and SELL signal with arrows, alerts and notifications. The parameters are fixed and automatically calculated on each time frame. Example: If you install indicator on EURUSD, timeframe M5: the indicator will detect the main trend with the Moving Average on this ti
DYJ TradingView
Daying Cao
5 (1)
DYJ TRADINGVIEW is a multi indicator rating system, using the rating signals counts and analysis tools to find entry opportunities in global markets DYJ TRADINGVIEW has 10 built-in indicators for market analysis. Indicator-based analysis is used by many traders to help them make decisions on what trades to take and where to enter and exit them.  We use several different types that can complement each other well. Use us to follow your market, You can find more accurate transactions. The trend ind
Your Trend Friend
Luigi Nunes Labigalini
5 (1)
The trend is your friend! Look at the color of the indicator and trade on that direction. It does not  repaint. After each candle is closed, that's the color of the trend. You can focus on shorter faster trends or major trends, just test what's most suitable for the symbol and timeframe you trade. Simply change the "Length" parameter and the indicator will automatically adapt. You can also change the color, thickness and style of the lines. Download and give it a try! There are big movements w
First of all Its worth emphasizing here that this Trading Tool is Non Repainting , Non Redrawing and Non Lagging Indicator , Which makes it ideal for professional trading . Online course, user manual and demo. The Smart Price Action Concepts Indicator is a very powerful tool for both new and experienced traders . It packs more than 20 useful indicators into one , combining advanced trading ideas like Inner Circle Trader Analysis and Smart Money Concepts Trading Strategies . This indicator focus
Magic Finger can help you identify trends and trading opportunities clearly. The finger points to the open position signal, and the discoloration line is confirmed by the trend. If you are a day trader, you can choose to trade during a period of active trading, referring to the discoloration line as the basis for the next order, finger signal as a filter. If you are a trend trader, you can choose a period above H1, wait for the appearance of the finger signal in the key price area, and enter th
Crash 1000 Scalping Indicator for the Crash 1000 Deriv Synthetic Index. Introduction The Crash 1000 Scalping Indicator is a specialized tool designed for the Crash 1000 index on the Deriv Synthetic market. This indicator is particularly useful for scalping on the M1 timeframe, helping traders to identify precise entry and exit points for buy positions. It is designed to be non-repainting, providing clear signals with audible alerts and push notifications, and is compatible with mobile devices th
To get access to MT4 version please click here . - This is the exact conversion from TradingView: "Stochastic Momentum Index" By "UCSgears". - This is a popular version of stochastic oscillator on tradingview. - This is a light-load processing and non-repaint indicator. - Buffers are available for the lines on chart. - You can message in private chat for further changes you need. Thanks for downloading
Elevate Your Trading Experience with Wamek Trend Consult!   Unlock the power of precise market entry with our advanced trading tool designed to identify early and continuation trends. Wamek Trend Consult empowers traders to enter the market at the perfect moment, utilizing potent filters that reduce fake signals, enhancing trade accuracy, and ultimately increasing profitability.   Key Features: 1. Accurate Trend Identification: The Trend Consult indicator employs advanced algorithms and unparall
To download MT4 version please click here . - This is the exact conversion from TradingView: "Trend Direction Force Index - TDFI [wm]" By "causecelebre". - The screenshot shows similar results from tradingview and Metatrader when tested on ICMarkets on both platforms. - This indicator uses multiple levels of averaging to detect trend strength. - You can optimize filter low and filter high levels to achieve best results. - You have access to buffers to use in EAs. - This is a light-load processin
This indicator finds Three Drives patterns. The Three Drives pattern is a 6-point reversal pattern characterised by a series of higher highs or lower lows that complete at a 127% or 161.8% Fibonacci extension. It signals that the market is exhausted and a reversal can happen. [ Installation Guide | Update Guide | Troubleshooting | FAQ | All Products ] Customizable pattern sizes Customizable colors and sizes Customizable breakout periods Customizable 1-2-3 and 0-A-B ratios It implements visual/s
Premium level is a unique indicator with more than 80% accuracy of correct predictions! This indicator has been tested for more than two months by the best Trading Specialists! The author's indicator you will not find anywhere else! From the screenshots you can see for yourself the accuracy of this tool! 1 is great for trading binary options with an expiration time of 1 candle. 2 works on all currency pairs, stocks, commodities, cryptocurrencies Instructions: As soon as the red arrow app
This Indicator enhances the default Relative Strength Index (RSI) by introducing several improvements. First, it visually highlights overbought and oversold regions by changing the RSI color from white to red. Second, it includes additional reference lines at 20, 40, 50, 60, and 80, providing a clearer framework for assessing RSI values. The most notable feature is the use of the middle 50-line to indicate the current market cycle. The color of the 50-line dynamically reflects the cycle: green f
PipFinite Exit EDGE MT5
Karlo Wilson Vendiola
4.86 (29)
Did You Have A Profitable Trade But Suddenly Reversed? In a solid strategy, exiting a trade is equally important as entering. Exit EDGE helps maximize your current trade profit and avoid turning winning trades to losers. Never Miss An Exit Signal Again Monitor all pairs and timeframes in just 1 chart www.mql5.com/en/blogs/post/726558 How To Trade You can close your open trades as soon as you receive a signal Close your Buy orders if you receive an Exit Buy Signal. Close your Sell orders if
This indicator obeys the popular maxim that: "THE TREND IS YOUR FRIEND" It paints a Blue line for BUY and also paints a RED line for SELL. (you can change the colors). It gives alarms and alerts of all kinds. can be used for all currency pairs and timeframes. Yes, as easy and simple as that. Even a newbie can use it to make great and reliable trades. MetaTrader 4 Version    
| Fully-automated Smart Money Concept (ICT) inspired trading solution with multi-strategy capabilities | Built by a grid trader >> for grid traders.  This is MT5 version, click  here  for  Blue CARA MT4  (settings and logics are same in both versions)     Real monitoring signal  -->  Cara Gold Intro Blue CARA EA   ('CARA') - short for  C omprehensive  A lgorithmic   R esponsive   A dvisor is a next-gen  multi-currency    multi-timeframe  EA base on the widely known (and perhaps the most popul
Cumulative delta indicator As most traders believe, the price moves under the pressure of market buying or selling. When someone redeems an offer standing in the cup, the deal is a "buy". If someone pours into the bid standing in the cup - the deal goes with the direction of "sale". The delta is the difference between purchases and sales. A cumulative delta - the difference between the cumulative sum of purchases and sales for a certain period of time. It allows you to see who is currently contr
Volality Index Scalper
Lesedi Oliver Seilane
5 (1)
Volality Index scalper indicator  Meant for Volality pairs such as Volality 10, 25, 50, 75 and 100 The indicator works on all timeframes from the 1 minute to the monthly timeframe the indicator is non repaint the indicator has 3 entry settings 1 color change on zero cross 2 color change on slope change 3 color change on signal line cross Orange line is your sell signal Blue line is your buy signal.
Trend Monitor MT5
Pavel Zamoshnikov
4.5 (2)
The indicator generates early signals basing on ADX reading data combined with elements of price patterns. Works on all symbols and timeframes. The indicator does not redraw its signals. You see the same things on history and in real time. For better visual perception signals are displayed as arrows (in order not to overload the chart). Features The best results are obtained when the indicator works on two timeframes. For example: M30 – the indicator shows the main trend; M5 – the indicator gen
Buyers of this product also purchase
Golden Trend Indicator MT5
Noha Mohamed Fathy Younes Badr
4.88 (16)
Golden Trend indicator  is The best indicator for predicting trend movement this indicator never lags and never repaints and never back paints    and give  arrow buy and sell    before the candle appear  and it will help you and  will make your trading decisions clearer its work on all currencies and  gold and crypto and all time frame This unique  indicator uses very secret algorithms to catch the  trends, so you can trade using this indicator and see the trend clear on charts  manual guide and
TPSpro RFI Levels MT5
Roman Podpora
4.53 (19)
A key element in trading is zones or levels from which decisions to buy or sell a trading instrument are made. Despite attempts by major players to conceal their presence in the market, they inevitably leave traces. Our task was to learn how to identify these traces and interpret them correctly. ИНСТРУКЦИЯ RUS         INSTRUCTIONS  ENG         R ecommended to use with an indicator   -   TPSpro  TREND PRO -  Version MT4 Bonus: 6 months of  " RFI SIGNALS "  subscription with your purchase! Main f
FX Volume MT5
Daniel Stein
4.82 (17)
FX Volume: Experience Genuine Market Sentiment from a Broker’s Perspective Quick Overview Looking to elevate your trading approach? FX Volume provides real-time insights into how retail traders and brokers are positioned—long before delayed reports like the COT. Whether you’re aiming for consistent gains or simply want a deeper edge in the markets, FX Volume helps you spot major imbalances, confirm breakouts, and refine your risk management. Get started now and see how genuine volume data can
TPSproTREND PrO MT5
Roman Podpora
4.71 (17)
TPSpro TREND PRO  - is a trend indicator that automatically analyzes the market and provides information about the trend and each of its changes, as well as giving signals for entering trades without redrawing! The indicator uses each candle, analyzing them separately. referring to different impulses - up or down impulse. Exact entry points into transactions for currencies, crypto, metals, stocks, indices!  ИНСТРУКЦИЯ RUS         INSTRUCTIONS  ENG       R ecommended to use with an indicator   -
This indicator is based on the mathematics of the great trader W.D. Ganna. With its help, you can easily find strong levels by analyzing swings to find the optimal entry point. The indicator works on all instruments and all timeframes. The indicator is fully manual and has control buttons. All you need to do is press the NEW button, a segment will appear, which you can place on any movement, swing or even 1 candle that you want to analyze. By placing the segment, press the OK button. A grid (th
Quantum TrendPulse
Bogdan Ion Puscasu
5 (13)
Introducing Quantum TrendPulse , the ultimate trading tool that combines the power of SuperTrend , RSI , and Stochastic into one comprehensive indicator to maximize your trading potential. Designed for traders who seek precision and efficiency, this indicator helps you identify market trends, momentum shifts, and optimal entry and exit points with confidence. Key Features: SuperTrend Integration: Easily follow the prevailing market trend and ride the wave of profitability. RSI Precision: Detect
This indicator identifies and displays zones, as it were areas of strength, where the price will unfold. The indicator can work on any chart, any instrument, at any timeframe. The indicator has two modes. The indicator is equipped with a control panel with buttons for convenience and split into two modes. Manual mode: To work with manual mode, you need to press the NEW button, a segment will appear. This segment is stretched over the movement and the LVL button is pressed. The level is displayed
PUMPING STATION – Your Personal Profit Pump on Forex!   Introducing PUMPING STATION — a revolutionary Forex indicator that will transform your trading into a profit-generating machine! This indicator is not just an assistant but a full-fledged trading system with powerful algorithms that will help you start earning consistently. When you purchase this product, you also get FOR FREE: Exclusive Set Files: For automatic setup and maximum performance. 4 Hours of Video Training: Learn how to trade us
This dashboard shows the latest available   harmonic patterns   for the selected symbols, so you will save time and be more efficient /   MT4 version . Free Indicator:   Basic Harmonic Pattern Comparison of "Basic Harmonic Pattern" vs. "Basic Harmonic Patterns Dashboard" Indicators Feature Basic Harmonic Pattern Basic Harmonic Patterns Dashboard Functionality Detects and displays harmonic patterns on a single chart Searches multiple symbols and timeframes for harmonic patterns, displays res
PZ Swing Trading MT5
PZ TRADING SLU
5 (5)
Protect against whipsaws: revolutionize your swing trading approach Swing Trading is the first indicator designed to detect swings in the direction of the trend and possible reversal swings. It uses the baseline swing trading approach, widely described in trading literature. The indicator studies several price and time vectors to track the aggregate trend direction and detects situations in which the market is oversold or overbought and ready to correct. [ Installation Guide | Update Guide | Tro
Top indicator for MT5   providing accurate signals to enter a trade without repainting! It can be applied to any financial assets:   forex, cryptocurrencies, metals, stocks, indices .  Watch  the video  (6:22) with an example of processing only one signal that paid off the indicator! MT4 version is here It will provide pretty accurate trading signals and tell you when it's best to open a trade and close it. Most traders improve their trading results during the first trading week with the help of
Easy Breakout MT5
Mohamed Hassan
5 (3)
After your purchase, feel free to contact me for more details on how to receive a bonus indicator called VFI, which pairs perfectly with Easy Breakout for enhanced confluence!     Easy Breakout MT5   is a powerful price action trading system built on one of the most popular and widely trusted strategies among traders: the   Breakout strategy ! This indicator delivers crystal-clear Buy and Sell signals based on breakouts from key support and resistance zones. Unlike typical breakout indicators
MetaForecast M5
Vahidreza Heidar Gholami
5 (2)
MetaForecast predicts and visualizes the future of any market using different powerful methods. While financial markets are not always predictable, if there are patterns in the past data, MetaForecast can learn and predict the future as accurately as possible. It features a complete implementation of neural networks embedded directly into the indicator, enabling traders to create and train AI models using data from multiple symbols to learn complex patterns. MetaForecast leverages your computer'
RelicusRoad Pro MT5
Relicus LLC
4.78 (18)
How many times have you bought a trading indicator with great back-tests, live account performance proof with fantastic numbers and stats all over the place but after using it, you end up blowing your account? You shouldn't trust a signal by itself, you need to know why it appeared in the first place, and that's what RelicusRoad Pro does best! User Manual + Strategies + Training Videos + Private Group with VIP Access + Mobile Version Available A New Way To Look At The Market RelicusRoad is th
Timeframes Trend Scanner is a trend analyzer or trend screener indicator that helps you know the trend in all timeframes of symbol you're watching. This indicator provides clear & detailed analysis results on a beautiful dashboard, let you able to use this result right away without need to do any additional analysis. Please note that this indicator doesn't work with Strategy Tester. Sorry for that! How it works Step 1: Calculate values of 23 selected & trusted technical indicators (Oscillator &
EXCLUSIVE! JUST  10 COPIES  AVAILABLE!   BONUS AUX VIP Club 2024 : Include EA CAP, CEP, LDH, PSC307 & AO4C to enhance the performance of this tool to its maximum potential  Click Here to Download Files   ( for users only ) FREE Trading Education Available Daily via Zoom --- For More Info or Instant Message Click link ---  https://t.me/abcdwave Transform your trading with the "Five Magic Bullets" Indicator, tailored for traders who embrace the power of Elliott Wave Chaos Theory.
Bill Williams Advanced
Siarhei Vashchylka
5 (9)
Bill Williams Advanced is designed for automatic chart analysis using Bill Williams' "Profitunity" system. The indicator analyzes four timeframes at once. Manual (Be sure to read before purchasing) Advantages 1. Automatically analyzes the chart using the "Profitunity" system of Bill Williams. The found signals are placed in a table in the corner of the screen. 2. Equipped with a trend filter based on the Alligator indicator. Most of the system signals are recommended to be used only according t
Gold Trend 5
Sergei Linskii
3.5 (2)
Gold Trend - this is a good stock technical indicator. The indicator algorithm analyzes the price movement of an asset and reflects volatility and potential entry zones. The best indicator signals: For SELL = red histogram + red SHORT pointer + yellow signal arrow in the same direction. For BUY = blue histogram + blue LONG pointer + aqua signal arrow in the same direction. Benefits of the indicator: The indicator produces signals with high accuracy. A confirmed arrow signal can only be redrawn
CBT Quantum Maverick High-Efficiency Binary Trading System CBT Quantum Maverick is a finely tuned, high-performance binary options trading system designed for traders seeking precision, simplicity, and disciplined trading. No customization is required—this system is optimized for effective results right out of the box. Simply follow the signals, which can be mastered with a bit of practice. Key Features: Signal Precision: New-bar-based trading signals—targeting the next candle based on curren
Royal Scalping Indicator M5
Vahidreza Heidar Gholami
5 (6)
Royal Scalping Indicator is an advanced price adaptive indicator designed to generate high-quality trading signals. Built-in multi-timeframe and multi-currency capabilities make it even more powerful to have configurations based on different symbols and timeframes. This indicator is perfect for scalp trades as well as swing trades. Royal Scalping is not just an indicator, but a trading strategy itself. Features Price Adaptive Trend Detector Algorithm Multi-Timeframe and Multi-Currency Trend Low
Elliott Wave Trend was designed for the scientific wave counting. This tool focuses to get rid of the vagueness of the classic Elliott Wave Counting using the guideline from the template and pattern approach. In doing so, firstly Elliott Wave Trend offers the template for your wave counting. Secondly, it offers Wave Structural Score to assist to identify accurate wave formation. It offers both impulse wave Structural Score and corrective wave Structure Score. Structural Score is the rating to sh
This dashboard discovers and displays the  Supply  and  Demand  zones on the chart, both in scalping and long term mode, depending on your trading strategy for the selected symbols. In addition, the scanner mode of the dashboard helps you to check all desired symbols at a glance and not to miss any suitable positions /   MT4 version Free indicator:   Basic Supply Demand Features Allows you to view trading opportunities on   multiple currency pairs , giving you a clear and concise view of all p
Hello I Want to introduce The Forex Buy Sell Arrow Premium MT5 i recently release this premium indicator! its 1000% Non Repaint Indicator, It Work Perfectly Well,, i tested it day by day, Just mind blowing Result,  Including Powerful trend Algorithm! How It Work? well, it work market trend formula, when trend Bullish Or when trend Bearish,  Recommend Timeframe M30, H1 it work all timeframe, and all currency pair, 100% non repaint, How to take signal From Forex Buy Sell Arrow Premium Ind
Gold ATR MTF - this is a fine stock technical indicator.  The algorithm of the indicator ATR (Average True Range) analyses the movement of the asset price and reflects volatility by drawing the corresponding levels in specified percentages (%) of the opening price of the specified timeframe (D1). Indicators (red and/or blue D1 H4) of the symbol price movement direction and arrow signals are additional and essential aids for comfortable and profitable intraday trading and/or scalping. Daily profi
Royal Wave Pro M5
Vahidreza Heidar Gholami
3.5 (4)
Royal Wave is a Trend-Power oscillator which has been programmed to locate and signal low-risk entry and exit zones. Its core algorithm statistically analyzes the market and generates trading signals for overbought, oversold and low volatile areas. By using a well-designed alerting system, this indicator makes it easier to make proper decisions regarding where to enter and where to exit trades. Features Trend-Power Algorithm Low risk Entry Zones and Exit Zones Predictions for Overbought and Over
Golden Spikes Detector
Batsirayi L Marango
3.25 (4)
Golden Spikes Detector This indicator is based on an advanced strategy primarily for trading spikes on Boom and Crash Indices. Complex algorithms were implemented to detect high probability entries only. It alerts on potential Buy and Sell entries. To trade spikes on the Deriv or Binary broker, only take Buy Boom and Sell Cash alerts. It was optimised to be loaded on 5-minute timeframe although multiple timeframe analysis is done in the background. Features ·             Desktop pop up and sound
Trend indicators are one of the areas of technical analysis for use in trading on financial markets. The Angular Trend Lines indicator comprehensively determines the trend direction and generates entry signals. In addition to smoothing the average direction of candles, it also uses the slope of the trend lines. The principle of constructing Gann angles was taken as the basis for the slope angle. The technical analysis indicator combines candlestick smoothing and chart geometry. There are two ty
Introducing   Quantum Breakout PRO , the groundbreaking MQL5 Indicator that's transforming the way you trade Breakout Zones! Developed by a team of experienced traders with trading experience of over 13 years,   Quantum Breakout PRO   is designed to propel your trading journey to new heights with its innovative and dynamic breakout zone strategy. Quantum Breakout Indicator will give you signal arrows on breakout zones with 5 profit target zones and stop loss suggestion based on the breakout b
The principle of this indicator is very simple: detecting the trend with Moving Average, then monitoring the return point of graph by using the crossing of Stochastic Oscillator and finally predicting BUY and SELL signal with arrows, alerts and notifications. The parameters are fixed and automatically calculated on each time frame. Example: If you install indicator on EURUSD, timeframe M5: the indicator will detect the main trend with the Moving Average on this timeframe (for example the Moving
Quantum Trend Sniper
Bogdan Ion Puscasu
4.73 (51)
Introducing   Quantum Trend Sniper Indicator , the groundbreaking MQL5 Indicator that's transforming the way you identify and trade trend reversals! Developed by a team of experienced traders with trading experience of over 13 years,   Quantum Trend Sniper Indicator   is designed to propel your trading journey to new heights with its innovative way of identifying trend reversals with extremely high accuracy. ***Buy Quantum Trend Sniper Indicator and you could get Quantum Breakout Indicator for
More from author
PZ Swing Trading MT5
PZ TRADING SLU
5 (5)
Protect against whipsaws: revolutionize your swing trading approach Swing Trading is the first indicator designed to detect swings in the direction of the trend and possible reversal swings. It uses the baseline swing trading approach, widely described in trading literature. The indicator studies several price and time vectors to track the aggregate trend direction and detects situations in which the market is oversold or overbought and ready to correct. [ Installation Guide | Update Guide | Tro
PZ Trend Trading MT5
PZ TRADING SLU
3.8 (5)
Capture every opportunity: your go-to indicator for profitable trend trading Trend Trading is an indicator designed to profit as much as possible from trends taking place in the market, by timing pullbacks and breakouts. It finds trading opportunities by analyzing what the price is doing during established trends. [ Installation Guide | Update Guide | Troubleshooting | FAQ | All Products ] Trade financial markets with confidence and efficiency Profit from established trends without getting whip
PZ Turtle Trading EA MT5
PZ TRADING SLU
2.33 (3)
This expert advisor implements the original Dennis and Eckhardt trading system, commonly known as The Turtle Trader. It trades exactly like the original turtles did, and can be used by experienced traders to capture trends in up or down markets. [ Installation Guide | Update Guide | Troubleshooting | FAQ | All Products ] Easy to use and supervise Fully configurable strategy settings Fully configurable trading settings Works for ECN/Non-ECN brokers and 2-3-4-5 digit symbols Works for CFDs and for
Trade smarter, not harder: Empower your trading with Harmonacci Patterns This is arguably the most complete harmonic price formation auto-recognition indicator you can find for the MetaTrader Platform. It detects 19 different patterns, takes fibonacci projections as seriously as you do, displays the Potential Reversal Zone (PRZ) and finds suitable stop-loss and take-profit levels. [ Installation Guide | Update Guide | Troubleshooting | FAQ | All Products ] It detects 19 different harmonic pri
This is the latest iteration of my famous scalper, Goldfinch EA, published for the first time almost a decade ago. It scalps the market on sudden volatility expansions that take place in short periods of time: it assumes and tries to capitalize of inertia in price movement after a sudden price acceleration. This new version has been simplified to allow the trader use the optimization feature of the tester easily to find the best trading parameters. [ Installation Guide | Update Guide | Troublesh
PZ Harmonacci Patterns
PZ TRADING SLU
3.17 (6)
Trade smarter, not harder: Empower your trading with Harmonacci Patterns This is arguably the most complete harmonic price formation auto-recognition indicator you can find for the MetaTrader Platform. It detects 19 different patterns, takes fibonacci projections as seriously as you do, displays the Potential Reversal Zone (PRZ) and finds suitable stop-loss and take-profit levels. [ Installation Guide | Update Guide | Troubleshooting | FAQ | All Products ] It detects 19 different harmonic pric
PZ Trend Trading
PZ TRADING SLU
4.8 (5)
Capture every opportunity: your go-to indicator for profitable trend trading Trend Trading is an indicator designed to profit as much as possible from trends taking place in the market, by timing pullbacks and breakouts. It finds trading opportunities by analyzing what the price is doing during established trends. [ Installation Guide | Update Guide | Troubleshooting | FAQ | All Products ] Trade financial markets with confidence and efficiency Profit from established trends without getting whip
PZ Support Resistance
PZ TRADING SLU
3.33 (3)
Unlock key market insights with automated support and resistance lines Tired of plotting support and resistance lines? This is a multi-timeframe indicator that detects and plots supports and resistance lines in the chart with the same precision as a human eye would. As price levels are tested over time and its importance increases, the lines become thicker and darker, making price leves easy to glance and evaluate. [ Installation Guide | Update Guide | Troubleshooting | FAQ | All Products ] Boos
This is the latest iteration of my famous indicator, Reversal Fractals, published for the first time almost a decade ago. It examines the price structure of fractals to determine possible reversal points in the market, providing timing to positional traders that already have a fundamental or technical valuation model. [ Installation Guide | Update Guide | Troubleshooting | FAQ | All Products ] Reversal fractals can start long trends The indicator is non repainting It implements alerts of all ki
This is a smooth and responsive accelerometer which reveals the market trend and strength. [ Installation Guide | Update Guide | Troubleshooting | FAQ | All Products ] Two moving averages indicate trend direction The histogram represents strength of the price movement It draws buy and sell zones as colored vertical lines Should be used as a confirmation indicator Customizable line widths and colors It implements alerts of all kinds This indicator is similar to MACD but aims to react faster to
This expert advisor implements the original Dennis and Eckhardt trading system, commonly known as The Turtle Trader. It trades exactly like the original turtles did, and can be used by experienced traders to capture trends in up or down markets. [ Installation Guide | Update Guide | Troubleshooting | FAQ | All Products ] Easy to use and supervise Fully configurable strategy settings Fully configurable trading settings Works for ECN/Non-ECN brokers and 2-3-4-5 digit symbols Works for CFDs and for
PZ Day Trading MT5
PZ TRADING SLU
2.83 (6)
Effortless trading: non-repainting indicator for accurate price reversals This indicator detects price reversals in a zig-zag fashion, using only price action analysis and a donchian channel. It has been specifically designed for short-term trading, without repainting or backpainting at all. It is a fantastic tool for shrewd traders aiming to increase the timing of their operations. [ Installation Guide | Update Guide | Troubleshooting | FAQ | All Products ] Amazingly easy to trade It provides
PZ Swing Trading
PZ TRADING SLU
5 (3)
Protect against whipsaws: revolutionize your swing trading approach Swing Trading is the first indicator designed to detect swings in the direction of the trend and possible reversal swings. It uses the baseline swing trading approach, widely described in trading literature. The indicator studies several price and time vectors to track the aggregate trend direction and detects situations in which the market is oversold or overbought and ready to correct. [ Installation Guide | Update Guide | Tro
Tired of plotting trendlines? The PZ TrendLines indicator applies a mechanical approach to the construction of trend lines for you! [ Installation Guide | Update Guide | Troubleshooting | FAQ | All Products ] It can draw up to 18 trendlines Trendlines can be optionally based on fractals Each line represents a breakout level Each trendline can be broken or rejected Configurable amount of lines Configurable colors Author Arturo López Pérez, private investor and speculator, software engineer and
This indicator analyzes price action patterns and helps you to make positive equity decisions in the binary options market. [ Installation Guide | Update Guide | Troubleshooting | FAQ | All Products ] Easy to trade Trade both call and put options No crystal ball and no predictions The indicator is non-repainting The only strategy suitable for binary options is applying a mathematical approach, like professional gamblers do. It is based on the following principles: Every binary option represents
PZ Risk Management
PZ TRADING SLU
5 (1)
This indicator monitors the vital constants of your trading account to keep it healthy and away from excessive risks. It monitors all trades, absolute exposure, account floating point and leverage currently in use, using different color codes for your interpretation.  [ Installation Guide | Update Guide | Troubleshooting | FAQ | All Products ] Amazingly easy to understand The indicator is clean and simple It calculates exposure by pairs and currencies Keep your used leverage controlled at all ti
PZ Wolfe Waves
PZ TRADING SLU
1 (1)
Precision trading: leverage wolfe waves for accurate signals Wolfe Waves are naturally occurring trading patterns present in all financial markets and represent a fight towards an equilibrium price. These patterns can develop over short and long-term time frames and are one of the most reliable predictive reversal patterns in existence, normally preceding strong and long price movements. [ Installation Guide | Update Guide | Troubleshooting | FAQ | All Products ] Clear trading signals Amazingly
PZ Support Resistance MT5
PZ TRADING SLU
4.17 (6)
Unlock key market insights with automated support and resistance lines Tired of plotting support and resistance lines? This is a multi-timeframe indicator that detects and plots supports and resistance lines in the chart with the same precision as a human eye would. As price levels are tested over time and its importance increases, the lines become thicker and darker, making price leves easy to glance and evaluate. [ Installation Guide | Update Guide | Troubleshooting | FAQ | All Products ] Boos
PZ Chart Overlay MT5
PZ TRADING SLU
4 (1)
Master the market: harness the power of statistical arbitrage This indicator showcases the price action of multiple instruments on a single chart, enabling you to compare the fluctuations of different assets and seamlessly implement statistical arbitrage strategies. Its main usage is to find correlated symbols which are temporarily out of whack. [ Installation Guide | Update Guide | Troubleshooting | FAQ | All Products ] Find overbought or oversold currency pairs easily Plot up to six currency
PZ Goldfinch Scalper EA
PZ TRADING SLU
1 (4)
This is the latest iteration of my famous scalper, Goldfinch EA, published for the first time almost a decade ago. It scalps the market on sudden volatility expansions that take place in short periods of time: it assumes and tries to capitalize of inertia in price movement after a sudden price acceleration. This new version has been simplified to allow the trader use the optimization feature of the tester easily to find the best trading parameters. [ Installation Guide | Update Guide | Troublesh
Identify over 30 candlestick patterns with precision This indicator recognizes over 30 Japanese Candlestick Patterns and highlights them beautifully on the chart. It is simply one of those indicators price action traders can't live without. [ Installation Guide | Update Guide | Troubleshooting | FAQ | All Products ] Boost your technical analysis overnight Detect japanese candlestick patterns easily Trade reliable and universal reversal patterns Hop onto established trends safely using continua
Stay ahead of the market: predict buying and selling pressure with ease This indicator analyzes past price action to anticipate buying and selling pressure in the market: it does so by looking back into the past and analyzing price peaks and valleys around the current price. It is a state-of-the-art confirmation indicator. [ Installation Guide | Update Guide | Troubleshooting | FAQ | All Products ] Predict buying and selling pressure in the market Avoid getting caught in buying selling frenzies
This indicator displays pivot points in the chart, including historical vales, and supports many calculation modes for Pivot Points and S/R levels. [ Installation Guide | Update Guide | Troubleshooting | FAQ | All Products ] It plots historical levels for backtesting purposes It allows you to select the reference timeframe It implements different Pivot Point calculation modes It implements different SR calculation modes It implements customizable colors and sizes Calculation Modes The indicato
Enhance your price action strategy: inside bar breakouts at your fingertips This indicator detects inside bars of several ranges, making it very easy for price action traders to spot and act on inside bar breakouts. [ Installation Guide | Update Guide | Troubleshooting | FAQ | All Products ] Easy to use and understand Customizable color selections The indicator implements visual/mail/push/sound alerts The indicator does not repaint or backpaint An inside bar is a bar or series of bars which is/a
PZ Correlation
PZ TRADING SLU
5 (1)
In the world of finance, correlation is a statistical measure of how two securities move in relation to each other. Correlations are used in advanced portfolio management. This indicator measures how different securities move in relation to a reference one, thus making portfolio management easier.  [ Installation Guide | Update Guide | Troubleshooting | FAQ | All Products ] Avoid concurrent trades in highly correlated instruments Find trading opportunities among highly correlated instruments Cor
This indicator finds Three Drives patterns. The Three Drives pattern is a 6-point reversal pattern characterised by a series of higher highs or lower lows that complete at a 127% or 161.8% Fibonacci extension. It signals that the market is exhausted and a reversal can happen. [ Installation Guide | Update Guide | Troubleshooting | FAQ | All Products ] Customizable pattern sizes Customizable colors and sizes Customizable breakout periods Customizable 1-2-3 and 0-A-B ratios It implements visual/s
This indicator evaluates the market sentiment using raw price action measurements, and it is an amazing trading confirmation. It can be used to take a trend-trade approach or a contrarian approach using reversal patterns. [ Installation Guide | Update Guide | Troubleshooting | FAQ | All Products ] Find early reversals Confirm short-term trades Detect indecision on the market Take contrarian trades near support and resistance levels Trade inside bars confirmed by overall direction of the market T
PZ Day Trading
PZ TRADING SLU
3.67 (3)
Effortless trading: non-repainting indicator for accurate price reversals This indicator detects price reversals in a zig-zag fashion, using only price action analysis and a donchian channel. It has been specifically designed for short-term trading, without repainting or backpainting at all. It is a fantastic tool for shrewd traders aiming to increase the timing of their operations. [ Installation Guide | Update Guide | Troubleshooting | FAQ | All Products ] Amazingly easy to trade It provides
This is a smooth and responsive accelerometer which reveals the market trend and strength. [ Installation Guide | Update Guide | Troubleshooting | FAQ | All Products ] Two moving averages indicate trend direction The histogram represents strength of the price movement It draws buy and sell zones as colored vertical lines Should be used as a confirmation indicator Customizable line widths and colors It implements alerts of all kinds This indicator is similar to MACD but aims to react faster to
PZ Turtle Trading
PZ TRADING SLU
5 (3)
The Turtle Trading Indicator implements the original Dennis Richards and Bill Eckhart trading system, commonly known as The Turtle Trader. This trend following system relies on breakouts of historical highs and lows to take and close trades: it is the complete opposite to the "buy low and sell high" approach. The main rule is "Trade an N-day breakout and take profits when an M-day high or low is breached (N must me above M)". [ Installation Guide | Update Guide | Troubleshooting | FAQ | All Prod
Filter:
No reviews
Reply to review
Version 8.3 2022.01.31
- Recompiled
Version 8.2 2020.10.15
- Bug fix
Version 8.0 2019.08.14
- Added SL / TP levels