• Overview
  • Reviews (2)
  • Comments
  • What's new

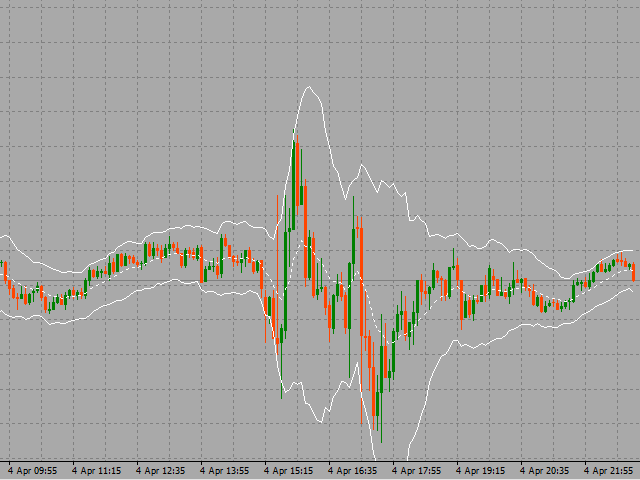
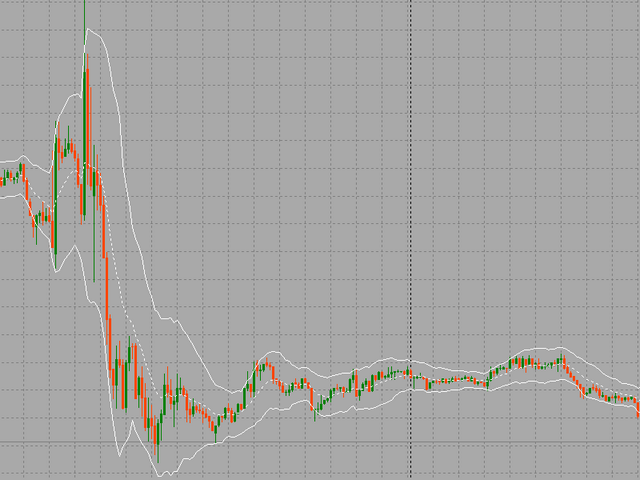
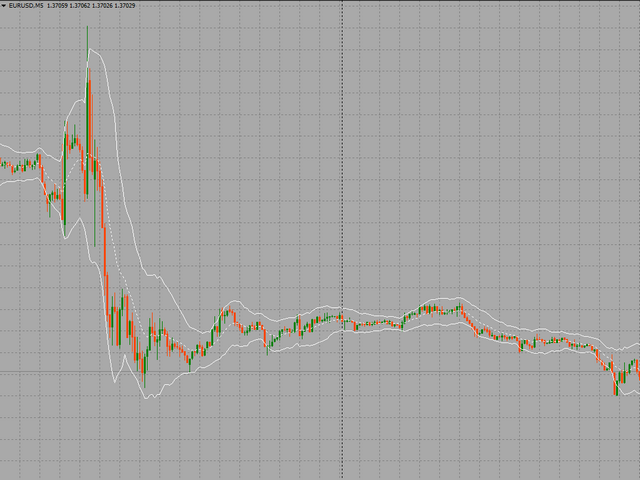
Extended Keltner Channel MT5

This is an extended version of Keltner channel. You can use 21 types of Moving Average and 11 methods of calculating the indicator's center line.

Moving Average types: Simple Moving Average, Exponential Moving Average, Wilder Exponential Moving Average, Linear Weighted Moving Average, Sine Weighted Moving Average, Triangular Moving Average, Least Square Moving Average (or EPMA, Linear Regression Line), Smoothed Moving Average, Hull Moving Average by Alan Hull, Zero-Lag Exponential Moving Average, Double Exponential Moving Average by Patrick Mulloy, T3 by T.Tillson, Instantaneous Trendline by J.Ehlers, Moving Median, Geometric Mean, Regularized EMA by Chris Satchwell, Integral of Linear Regression Slope, Combination of LSMA and ILRS, Triangular Moving Average generalized by J.Ehlers, Volume Weighted Moving Average, Smoothing by Mark Jurik.

Price calculation methods: Close, Open, High, Low, Median Price = (High+Low)/2, Typical Price = (High+Low+Close)/3, Weighted Close = (High+Low+Close*2)/4, Heiken Ashi Close, Heiken Ashi Open, Heiken Ashi High, Heiken Ashi Low.


Parameters

  • PeriodMA - channel average line period
  • MethodMA - channel average line smoothing method
  • PriceMA - applied price
  • PeriodATR - ATR indicator period
  • MulATR - ATR indicator multiplier
  • ShiftMA - channel forward/backward shift on a chart
  • AddDigits - additional improvement of the indicator values' accuracy in the amount of decimal places
  • AlertOnUpTouch - enable/disable alerts when touching the channel's upper line
  • AlertOnDnTouch - enable/disable alerts when touching the channel's lower line
  • EnableAlertMessage - enable/disable text messages
  • EnableAlertNotification - enable/disable notifications to mobile terminals
  • EnableAlertSound - enable/disable audio alerts
  • AlertUpSoundFileName - name of an audio file to be played when touching the upper channel line
  • AlertDnSoundFileName - name of an audio file to be played when touching the lower channel line
Recommended products
The indicator plots three consecutive channels by Close prices and checks if they match the scheme shown in the screenshots. The length of each channel is not fixed and is selected by the program within the range ChMin and ChMax . When the match is found, a signal is formed (an appropriately colored arrow). A possible stop loss level is displayed as a diamond. A signal may be accompanied by a pop-up window, a push notification and/or an email. The indicator works by Open prices. Parameters ChM
Introducing the PriceStream Channel - a classic channel indicator that allows traders to timely react to price movements beyond the established channel boundaries. This corridor is built based on the analysis of several candles, starting from the last one, which helps identify the extremes of the studied period. These extremes then create the channel lines. Trading within a channel is one of the most popular strategies in forex, and its simplicity makes it suitable even for beginners. The Pri
BeST_Keltner Channels Strategies MT5   is an  MT5  Indicator based on the original Keltner Channels Indicator and it can display in the Chart all the known Variations of Keltner Channels and also the corresponding 10 totally Strategies. Every such generally consists of a Central Moving Average Line and two Boundary Bands at a distance above and below it and can be traded mainly in a Trending Mode but also in a Ranging ReEntry Mode.  BeST_Keltner Channels Strategies Indicator Draws definite Bu
Fractals
Mikhail Nazarenko
The Fractals indicator displays on the chart only fractals with the specified parameters in the indicator settings. This allows you to more accurately record a trend reversal, excluding false reversals. According to the classical definition of a fractal, it is a candlestick - an extremum on the chart, which was not crossed by the price of 2 candles before and 2 candles after the appearance of a fractal candle. This indicator provides the ability to adjust the number of candles before and after t
K Channel
Pavel Gotkevitch
K_Channel is a technical indicator defining the current Forex market status - trend or flat. The indicator works on any timeframe. H1 and higher timeframes are recommended though to minimize false signals. The indicator is displayed as lines above and below EMA. Average True Range (ATR) is used as bands' width. Therefore, the channel is based on volatility. This version allows you to change all the parameters of the main Moving Average. Unlike Bollinger Bands that applies the standard deviation
Special Channel channel indicator is a classic indicator of a family of channel indicators, the use of which allows the trader to respond in time to the price out of the channel set for it. This corridor is built on the basis of the analysis of several candles, starting from the last, as a result of which the extrema of the studied interval are determined. It is they who create the channel lines. Trading in the channel is one of the most popular Forex strategies; its simplicity allows even be
InfinX Slope MT5
Stanislav Shtiliyanov
The Slope indicator   measures the slope of a linear regression , which is the line of best fit for a data series. A 20-period Slope, therefore, measures the slope of a 20-day linear regression. ... In general, a positive slope indicates an uptrend, while a negative slope indicates a downtrend. How do you use slope Indicator? By applying the slope indicator  to both the price chart and the price relative , chartists can quantify the price trend and relative performance with one indicator. A po
The Envelopes indicator determines the presence of a trend or flat. It has 3 types of signals, shows the probable retracement levels and levels of the possible targets. The Fibonacci coefficients are used in the indicator's calculations. Signals   (generated when touching the lines or rebounding from lines): Trend   - the middle line of the Envelopes has a distinct inclination; the lines below the channel's middle line are used for buy trades, the lines above the middle line and the middle line
Indicator Name : Fourier Transform Curve Indicator Description : The Fourier Transform Curve Indicator for MetaTrader 5 is a powerful tool that leverages Fourier analysis to depict curves directly on your price chart. It is designed to provide valuable insights into the underlying harmonic components of the price data. Parameters : Input Candle Count : This parameter allows you to specify the number of candles to include in the Fourier transformation calculation. A higher value will capture lon
//////////////////////////////////////////////// ////////////////////////////////// This indicator uses polynomial regression to plot three channels and six lines accordingly. The first channel and its borders with a large period, the second with an average and the third with a small period. The setup is simple - you only need to specify the colors and enable / disable the display of price labels. It is also very easy to understand the readings of this indicator. Channel lines are used to set s
"Advanced Daily VWAP with Standard Deviation and Trading Bands" Description: "The 'Advanced Daily VWAP with Standard Deviation and Trading Bands' indicator offers a comprehensive view for traders who wish to make the Volume Weighted Average Price (VWAP) the crux of their trading strategy. It not only calculates the VWAP on a daily basis but also incorporates standard deviation to give an accurate representation of market volatility. The trading bands are calculated using a 1.5% multiplier for th
Swing Tracer
Ely Alsedy
5 (2)
it depends on ATR period to get swing points to help make better trading decisions  blue dot and red dot is the default color scheme of course you can change it later if you'd like  you can change the following : ATR PERIOD  sending notifications number of times to send notifications  sending notifications to your smart phone that's it very simple to use just drag and drop and follow the trend 
Fit Channel MT5
Kaijun Wang
3.67 (3)
The market price usually falls between the borders of the channel    .   If the price is out of range , it is a trading signal or trading opportunity  . Basically , Fit Channel can be used to help determine overbought and oversold conditions in the market. When the market price is close to the upper limit, the market is considered overbought (sell zone). Conversely, when the market price is close to the bottom range, the market is considered oversold (buy zone). However, the research can
Legacy of Gann for MT5
Pavel Zamoshnikov
5 (6)
The indicator very accurately determines the levels of the possible end of the trend and profit fixing. The method of determining levels is based on the ideas of W.D.Gann, using an algorithm developed by his follower Kirill Borovsky. Extremely high reliability of reaching levels (according to K. Borovsky  - 80-90%) Indispensable for any trading strategy – every trader needs to determine the exit point from the market! Precisely determines targets on any timeframes and any instruments (forex, met
MA Slope
Serge Villasica
MA Slope is a simple indicator that measures the slope of a specific Moving Average.  We usually say that the price is in an uptrend when it is above the moving average, or it is in a downtrend when it is below the moving average. However, this information is inadequate since most of the time the market is in range. During range-bound markets, price moves back and forth around the Moving Average giving a lot of false signals.  MA Slope helps identify and validate trends as it directly measures t
Airplane   Trend   entry points should be used as potential market reversal points. The indicator works using the cyclic-wave dependence function. Thus, all entry points will be optimal points where the movement changes. The simplest way to use the indicator is to open a trade in the direction of an existing trend. The best result is obtained by combining the indicator with fundamental news, it can act as a news filter, that is, it can show how the market reacts to this or that news. The de
KDJ Index 4   交易实用必备工具指标 波浪自动计算指标,通道趋势交易 完美的趋势-波浪自动计算通道计算 , MT4版本 完美的趋势-波浪自动计算通道计算 , MT5版本 本地跟单复制交易 Easy And Fast Copy , MT4版本 Easy And Fast Copy , MT5版本 本地跟单复制交易 模拟试用 Easy And Fast Copy , MT4 模拟账号运行 Easy And Fast Copy , MT5 模拟账号运行 "Cooperative QQ:556024  "  "Cooperation wechat:556024"  "Cooperative email:556024@qq.com" 强烈推荐趋势指标, 波浪的标准自动计算   和   波浪的标准自动计算MT5版本     KDJ指标又叫 随机指标 ,是一种相当新颖、实用的技术分析指标,它起先用于期货市场的分析,后被广泛用于股市的中短期趋势分析,是期货和股票市场上最常用的技术分析工具。 随机指标KDJ一般是用于股票分析的统计体系,根据统计学原理,通过一个特定的周期(常为9日、9周等
Lomb Periodogram
Alfred Mirzasalikhov
The Lomb algorithm is designed to find the dominant cycle length in noisy data. It is used commonly in the field of astronomy and is very good at extracting cycle out of really noisy data sets. The Lomb phase plot is very similar to the Stochastics indicator. It has two threshold levels. When it crosses above the lower level it’s a buy signal. When it crosses the upper level it’s a sell signal. This is cycle-based indicator, the nicer waves look, the better the signal. Caution Also It’s really i
This indicator tracks the market trend with an unmatched reliability, by ignoring sudden fluctuations and market noise. It has been designed to trend-trade intraday charts and small timeframes. Its winning ratio is around 85%. [ Installation Guide | Update Guide | Troubleshooting | FAQ | All Products ] Amazingly easy to trade Find oversold/overbought situations Enjoy noise-free trading at all times Avoid being whipsawed in intraday charts The indicator analyzes its own quality and performance It
Linear Regressions Convergence Divergence is an oscillator indicator of a directional movement plotted as a difference of two linear regressions with lesser and greater periods. This is a further development of the ideas implemented in the standard MACD oscillator. It has a number of advantages due to the use of linear regressions instead of moving averages. The indicator is displayed in a separate window as a histogram. The signal line is a simple average of the histogram. The histogram value a
Swing or Scalp Mt5
Jermaine Wedderburn
Continuous Coloured dot lines under and above price when conditions are met. Arrows Red and Green for entry Points.  User can change the colours of the arrows in the colour section of the indicator.  It is consider a great scalping tool on lower time-frames, while higher time frames will have fewer opportunities but trades will possibly last longer.  There is an input for Alert on or off.  This can be used effectively on M15/M30 Chart until up to H4 chart time.  It is best if the user has some
Hush mt5
Iurii Plokhov
4.33 (3)
Hush mt5 is an advanced indicator that gives a signal about the overbought or oversold market in a certain period of time Hush mt5 the advantage of this indicator is that it does not disappear after the signal on the chart Suitable for any trade: forex, stocks, cryptocurrency, metals Hush mt5 can be used on any time period. The signal goes to the beginning of the next candle after the arrow Hush mt5 performed best on the period H1,H4,daily It can be used in addition to forex, in binar
Owl Smart Levels MT5
Sergey Ermolov
4.38 (37)
MT4 version  |   FAQ The Owl Smart Levels Indicator is a complete trading system within the one indicator that includes such popular market analysis tools as Bill Williams' advanced fractals , Valable ZigZag which builds the correct wave structure of the market, and Fibonacci levels which mark the exact levels of entry into the market and places to take profits. Detailed description of the strategy Instructions for working with the indicator Advisor-assistant in trading Owl Helper Private User
Automatic Fibonacci Tool Fibonacci retracements is a popular instrument used by technical analysts to determine potential Support and Resistance areas. In technical analysis, this tool is created by taking two extreme points (usually a peak and a minimum) on the chart and dividing the vertical distance by the key Fibonacci coefficients equal to 23.6%, 38.2%, 50%, 61.8%, and 100%. Our Automatic Fibonacci Tool is programmed to make thigs easier. Using this tool, there is no need to explicitly set
Keltner Channel indicator for MT5
Renaud Herve Francois Candel
Keltner Channel Indicator Keltner Channel is an oscillator like Bollinger Bands. Keltner Channel is a very good tool to time entries for your strategy. Keltner Channel displays a channel where price is supposed to stay unless we are in overbought or oversold situations. Various strategies use Keltner Channel indicator successfully to spot overbought / oversold situations and look for reversals. Keltner Channel indicator uses ATR to determine overbought and oversold situations. Inputs of the
All about time and price by ICT. This indicator provides a comprehensive view of ICT killzones, Silver Bullet times, and ICT Macros, enhancing your trading experience.  In those time windows price either seeks liquidity or imbalances and you often find the most energetic price moves and turning points. Features: Automatic Adaptation: The ICT killzones intelligently adapt to the specific chart you are using. For Forex charts, it follows the ICT Forex times: In EST timezone: Session: Asia: 20h00-0
Advanced Support and Resistance Support and resistance levels are widely used in trading. They are important as they show some key price levels. Before applying any strategy, one may consider it necessary to draw support and resistance. However, this process can take much time especially if one is to analyse a lot of currency pairs, commodities or indices. This Advanced Support and Resistance tool was designed for traders at any level, amateur to professional. It plots key support and resistance
神奇九转, 顾名思义就是每当出现数字9时,行情就很大的几率会发生逆转,这时应该注意止盈。是一个很有效的指标。 在序列显示和形成过程中,一旦出现不符合触发条件的情况,则前面序列数字消失,本次九转序列结构不存在。如果连续九天都达到触发条件,九转序列结构形成,价格走势可能发生反转。 九转序列可分为上升九转结构和下降九转结构,也就是九转序列在买多和买空以及判断各种走势反转是都可以使用。 九转序列买入建仓,即下降九转序列结构形成时,价格走势将要发生转变,考虑建仓买入。 买入条件:连续出现九根K线,并且满足收盘价都低于前一根K线收盘价,当第8、9根K线满足上述条件时,九转序列形成,投资者准备买入建仓。 使用分时九转时需要注意两点: 1、极端行情时(连续上涨或下跌),九转序列失效; 2、当九转序列完全形成时,再进场操作(尤其不用刚出现数字8或9就入场,一定要完全形成之后才可以。)
Easy Channels MT5
Alexander Nikolaev
5 (1)
This indicator draws price channels. Easy to use. It has various settings, for example, you can configure it to show channels only for buy or sell, you can display trend lines instead of channels. There are many trading strategies that are based on trading in channels, you can trade on the rebound from the borders of the channels, or the breakdown of the channel.   Parameters History - the maximum number of bars for building channels; Distance - the minimum distance from one maximum (or minimum
Contact me for instruction, any questions! Introduction V Bottoms and Tops are popular   chart patterns   among traders due to their potential for identifying trend reversals. These patterns are characterized by sharp and sudden price movements, creating a V-shaped or inverted V-shaped formation on the   chart . By recognizing these patterns, traders can anticipate potential shifts in market direction and position themselves accordingly.  V pattern is a powerful bullish/bearish reversal pattern
Buyers of this product also purchase
Atomic Analyst MT5
Issam Kassas
5 (14)
First of all Its worth emphasizing here that this Trading Indicator is   Non-Repainting   , Non Redrawing and Non Lagging Indicator   Indicator, Which makes it ideal from both manual and robot trading.  User manual: settings, inputs and strategy . The Atomic Analyst  is a PA Price Action Indicator that uses Strength and Momentum of the price to find a better edge in the market. Equipped with Advanced filters which help remove noises and false signals, and Increase Trading Potential. Using Mult
First of all Its worth emphasizing here that this Trading System is Non-Repainting   , Non Redrawing and Non Lagging Indicator Which makes it ideal from both manual and robot trading .  Online course, manual and download presets. The Smart Trend Trading System MT5 is a comprehensive trading solution tailored for new and experienced traders . It combines over 10 premium indicators and features more than 7 robust trading strategies , making it a versatile choice for diverse market conditions . Tre
Quantum Trend Sniper
Bogdan Ion Puscasu
5 (43)
Introducing   Quantum Trend Sniper Indicator , the groundbreaking MQL5 Indicator that's transforming the way you identify and trade trend reversals! Developed by a team of experienced traders with trading experience of over 13 years,   Quantum Trend Sniper Indicator   is designed to propel your trading journey to new heights with its innovative way of identifying trend reversals with extremely high accuracy. ***Buy Quantum Trend Sniper Indicator and you could get Quantum Breakout Indicator fo
Gold Stuff mt5
Vasiliy Strukov
4.89 (178)
Gold Stuff mt5 is a trend indicator designed specifically for gold and can also be used on any financial instrument. The indicator does not redraw and does not lag. Recommended time frame H1. Contact me immediately after the purchase to get   personal bonus!  You can get a free copy of our Strong Support and Trend Scanner indicator, please pm. me! Settings  and manual   here   SETTINGS Draw Arrow - on off. drawing arrows on the chart. Alerts -   on off audible alerts. E-mail notification - on of
Reversal First Impulse levels (RFI)      INSTRUCTIONS        RUS       -       ENG              R ecommended to use with an indicator   -   TREND PRO -  Version MT4                 A key element in trading is zones or levels from which decisions to buy or sell a trading instrument are made. Despite attempts by major players to conceal their presence in the market, they inevitably leave traces. Our task was to learn how to identify these traces and interpret them correctly. Main functions:: Di
First of all Its worth emphasizing here that this Trading Tool is Non Repainting , Non Redrawing and Non Lagging Indicator , Which makes it ideal for professional trading . Online course, user manual and demo. The Smart Price Action Concepts Indicator is a very powerful tool for both new and experienced traders . It packs more than 20 useful indicators into one , combining advanced trading ideas like Inner Circle Trader Analysis and Smart Money Concepts Trading Strategies . This indicator focus
FX Volume MT5
Daniel Stein
4.94 (17)
Visit our all-new   Stein Investments Welcome Page   to get the latest information, updates and trading strategies. FX Volume is the FIRST and ONLY volume indicator that provides a REAL insight into the market sentiment from a broker's point of view. It provides awesome insights into how institutional market participants, like brokers, are positioned in the Forex market, much faster than COT reports. Seeing this information directly on your chart is the real game-changer and breakthrough solut
Trend Screener Pro MT5
STE S.S.COMPANY
4.88 (64)
Unlock the Power of  Trends trading with Trend Screener Indicator: Your Ultimate Trend Trading Solution powered by fuzzy logic and Multi-currencies System ! Elevate your trend trading with Trend Screener, the revolutionary trend indicator powered by   fuzzy logic.  It is a powerful trend-following indicator that combines over  13 premium tools and features and 3 trading strategies  , making it a versatile choice to   make your Metatrader a Trend Analyzer. LIMITED TIME OFFER : Trend Screener Indi
FX Power MT5 NG
Daniel Stein
5 (5)
Trading GOLD, and currencies, with the dog walk strategy  - super smart Trading GOLD, and currencies, with the breakout strategy  - super easy Visit our all-new   Stein Investments Welcome Page   to get the latest information, updates and trading strategies. FX Power MT5 NG  is the next generation of our long-time very popular currency strength meter, FX Power.  And what does this next-generation strength meter offer? Everything you have loved about the original FX Power  PLUS GOLD/XAU st
Bill Williams Advanced
Siarhei Vashchylka
5 (5)
Bill Williams Advanced is designed for automatic chart analysis using Bill Williams' "Profitunity" system. The indicator analyzes four timeframes at once. Manual (Be sure to read before purchasing) Advantages 1. Automatically analyzes the chart using the "Profitunity" system of Bill Williams. The found signals are placed in a table in the corner of the screen. 2. Equipped with a trend filter based on the Alligator indicator. Most of the system signals are recommended to be used only accordi
XQ Indicator MetaTrader 5
Marzena Maria Szmit
5 (1)
Step into the realm of Forex trading with confidence and precision using XQ, a cutting-edge Forex indicator designed to elevate your trading game to unprecedented heights. Whether you're a seasoned trader or just stepping into the world of currency exchange, XQ Forex Indicator empowers you with the insights and signals needed to make informed trading decisions. The signal conditions are a combination of three indicators, and XQ Forex Indicator only display  medium and long-term trends . The ind
Top indicator for MT5   providing accurate signals to enter a trade without repainting! It can be applied to any financial assets:   forex, cryptocurrencies, metals, stocks, indices .  Watch  the video  (6:22) with an example of processing only one signal that paid off the indicator! MT4 version is here It will provide pretty accurate trading signals and tell you when it's best to open a trade and close it. Most traders improve their trading results during the first trading week with the help of
AW Trend Predictor MT5
AW Trading Software Limited
4.78 (58)
The combination of trend and breakdown levels in one system. An advanced indicator algorithm filters market noise, determines the trend, entry points, as well as possible exit levels. Indicator signals are recorded in a statistical module, which allows you to select the most suitable tools, showing the effectiveness of the signal history. The indicator calculates Take Profit and Stop Loss marks. Manual and instruction ->  HERE  / MT4 version ->  HERE How to trade with the indicator:  Trading wit
ICT, SMC, SMART MONEY CONCEPTS, SMART MONEY, Smart Money Concept, Support and Resistance, Trend Analysis, Price Action, Market Structure, Order Blocks, BOS/CHoCH,   Breaker Blocks ,  Momentum Shift,   Supply&Demand Zone/Order Blocks , Strong Imbalance, HH/LL/HL/LH,    Fair Value Gap, FVG,  Premium  &   Discount   Zones, Fibonacci Retracement, OTE, Buy Side Liquidity, Sell Side Liquidity, BSL/SSL Taken, Equal Highs & Lows, MTF Dashboard, Multiple Time Frame, BigBar, HTF OB, HTF Market Structure, 
TrendMaestro5
Stefano Frisetti
note: this indicator is for METATRADER4, if you want the version for METATRADER5 this is the link:  https://www.mql5.com/it/market/product/108106 TRENDMAESTRO ver 2.4 TRENDMAESTRO recognizes a new TREND in the bud, he never makes mistakes. The certainty of identifying a new TREND is priceless. DESCRIPTION TRENDMAESTRO identifies a new TREND in the bud, this indicator examines the volatility, volumes and momentum to identify the moment in which there is an explosion of one or more of these data a
TPSproTREND PrO MT5
Roman Podpora
4.88 (8)
TPSpro TRENDPRO  - is a trend indicator that automatically analyzes the market and provides information about the trend and each of its changes, as well as giving signals for entering trades without redrawing! The indicator uses each candle, analyzing them separately. referring to different impulses - up or down impulse. Exact entry points into transactions for currencies, crypto, metals, stocks, indices!  -  Version MT4               DETAILED DESCRIPTION               R ecommended to use with
Profit from market structure changes as price reverses and pulls back. The market structure reversal alert indicator identifies when a trend or price move is approaching exhaustion and ready to reverse. It alerts you to changes in market structure which typically occur when a reversal or major pullback are about to happen. The indicator identifies breakouts and price momentum initially, every time a new high or low is formed near a possible exhaustion point. The indicator draws in a rectangle on
** All Symbols x All Timeframes scan just by pressing scanner button ** ***Contact me after purchase to send you instructions and add you in "123 scanner group" for sharing or seeing experiences with other users. After 17 years of experience in the markets and programming, Winner indicator is ready. I would like to share with you! Introduction The 123 Pattern Scanner indicator with a special enhanced algorithm is a very repetitive common pattern finder with a high success rate . Interestingly,
Introducing   Quantum Breakout PRO , the groundbreaking MQL5 Indicator that's transforming the way you trade Breakout Zones! Developed by a team of experienced traders with trading experience of over 13 years,   Quantum Breakout PRO   is designed to propel your trading journey to new heights with its innovative and dynamic breakout zone strategy. Quantum Breakout Indicator will give you signal arrows on breakout zones with 5 profit target zones and stop loss suggestion based on the breako
Quantum Heiken Ashi PRO MT5
Bogdan Ion Puscasu
4.5 (8)
Introducing the Quantum Heiken Ashi PRO charts with integrated alerts Designed to provide clear insights into market trends, the Heiken Ashi candles are renowned for their ability to filter out noise and eliminate false signals. Say goodbye to confusing price fluctuations and hello to a smoother, more reliable chart representation. What makes the Quantum Heiken Ashi PRO truly unique is its innovative formula, which transforms traditional candlestick data into easy-to-read colored bars. Red and g
Golden Gate Algo MT5
James David Lane
4 (6)
Introducing GoldenGate Algo: A Cutting-Edge Trading Solution!  Discover a revolutionary approach to trading with GoldenGate Algo (GGA), an advanced indicator designed to elevate your trading experience. GGA provides a comprehensive set of features to empower users with precision and confidence in their trading decisions. Send me a message once you have purchased for access to the private Telegram. No re-painting! Pairs:   Any TimeFrames:   15m up to H1 Key Features: Buy and Sell Arrow Indic
TPA True Price Action indicator reveals the true price action of the market makers through 100% non-repainting signals strictly at the close of a candle! TPA shows entries and re-entries, every time the bulls are definitely stronger than the bears and vice versa. Not to confuse with red/green candles. The shift of power gets confirmed at the earliest stage and is ONE exit strategy of several. There are available now two free parts of the TPA User Guide for our customers. The first "The Basics"
Advanced Supply Demand MT5
Bernhard Schweigert
4.53 (15)
Best Solution for any Newbie or Expert Trader! This indicator is a unique, high quality and affordable trading tool because we have incorporated a number of proprietary features and a new formula. With this update, you will be able to show double timeframe zones. You will not only be able to show a higher TF but to show both, the chart TF, PLUS the higher TF: SHOWING NESTED ZONES. All Supply Demand traders will love it. :) Important Information Revealed Maximize the potential of Advanced Suppl
Easy By Sell is a market indicator for opening and closing positions. It becomes easy to track market entries with alerts. It indicates trend reversal points when a price reaches extreme values ​​and the most favorable time to enter the market. it is as effective as a Fibonacci to find a level but it uses different tools such as an algorithm based on ATR indicators and Stochastic Oscillator. You can modify these two parameters as you wish to adapt the settings to the desired period. My othe
Fractal Advanced MT5
Siarhei Vashchylka
5 (3)
Fractal Advanced - displays Fractal and Alligator indicators on the price chart. Has wide options for settings and customization. It is also equipped with alerts and a hotkey system. Manual (Be sure to read before purchasing) | Version for MT4 Advantages 1. The indicator does not fill the entire chart with fractals, but allows you to display only relevant signals. 2. The number of fractals is adjusted by scrolling the mouse while holding down the Shift key. 3. Instantly show/hide the Alligator
Gartley Hunter Multi
Siarhei Vashchylka
5 (7)
Gartley Hunter Multi - An indicator for searching for harmonic patterns simultaneously on dozens of trading instruments and on all possible timeframes. Manual (Be sure to read before purchasing) | Version for MT4 Advantages 1. Patterns: Gartley, Butterfly, Shark, Crab. Bat, Alternate Bat, Deep Crab, Cypher 2. Simultaneous search for patterns on dozens of trading instruments and on all possible timeframes 3. Search for patterns of all possible sizes. From the smallest to the largest 4. A
Was: $249  Now: $99   Market Profile defines a number of day types that can help the trader to determine market behaviour. A key feature is the Value Area, representing the range of price action where 70% of trading took place. Understanding the Value Area can give traders valuable insight into market direction and establish the higher odds trade. It is an excellent addition to any system you may be using. Inspired by Jim Dalton’s book “Mind Over Markets”, this indicator is designed to suit the
Auto Order Block with break of structure based on ICT and Smart Money Concepts (SMC) Futures Break of Structure ( BoS )             Order block ( OB )            Higher time frame Order block / Point of Interest ( POI )    shown on current chart           Fair value Gap ( FVG ) / Imbalance   -  MTF      ( Multi Time Frame )    HH/LL/HL/LH  -  MTF      ( Multi Time Frame )  Choch  MTF      ( Multi Time Frame )  Volume Imbalance     ,  MTF          vIMB Gap’s Power of 3 Equal High
IX Power MT5
Daniel Stein
5 (3)
IX Power   finally brings the unbeatable precision of FX Power to all your trading symbols. It accurately determines the intensity of short, medium and long-term trends in your favourite indices, stocks, commodities, ETFs, and even cryptocurrencies. You can   analyse everything   your terminal has to offer. Try it out and experience how   your timing improves significantly   when trading. Read about our latest strategic development -  Easy scalping with IX Power Visit our all-new   Stein Inve
**   All Symbols   x   All Timeframes   scan just by pressing scanner button ** *** Contact me after the purchase to send you instructions and add you in "Trend Reversal group" for sharing or seeing experiences with other users. Introduction: Trendlines are the most famous technical analysis in trading . Trendlines continually form on the charts of markets across all the different timeframes providing huge opportunities for traders to jump in and profit on the action. In the other hand,  The tre
More from author
The indicator allows you to determine the current price direction and market volatility. This version of the Traders Dynamic Index (TDI) has the redrawing of the historical data eliminated, the algorithm calculation speed optimized, more external parameters for a more precise adjustments, and its functionalities extended: added the selection of the initial oscillator and the smoothing methods of the averages. Parameters: Mode Osc - estimation oscillator selection; Period Osc - the calculation
Mini Charts MT5
Sergey Efimenko
4.91 (23)
The indicator displays minimized charts of any symbol from any timeframe. The maximum number of displayed charts is 28. The charts can be located both in the main and bottom window. Two display modes: candles and bars. Amount of displayed data (bars and candles) and chart sizes are adjustable. To work with a mini chat, you must first put the desired indicator(s) on a regular chart, then save it as a template and apply a template for the mini chart via the appropriate parameter, for example, for
FREE
The utility is designed to change the symbol of the current, all or selected charts, change the timeframe , as well as to synchronously move through the history of all charts (automatically or by clicking the button). The list of symbols is read from the "Market Watch" or is set manually. The color, size and position of the buttons are customizable. Synchronization of charts occurs according to the time of the first visible bar when you press the "SYNC" button or when moving the mouse/keyboard i
Mini Charts
Sergey Efimenko
4.31 (16)
The indicator displays minimized charts of any symbol from any timeframe. The maximum number of displayed charts is 28. The charts can be located both in the main and bottom window. Two display modes: candles and bars. Amount of displayed data (bars and candles) and chart sizes are adjustable. Parameters: Corner - display start corner (selected from the list) CandleMode - display mode: true - candles, false - bars ShowLastBid - enable/disable the last price display LastBidShiftX - last price lin
FREE
CPM Extended MT5
Sergey Efimenko
4.43 (7)
The algorithm is based on the idea of the Currency Power Meter indicator. In this version, the number of displayed values is unlimited, its code is more compact and fast, values of the current bar can be obtained through indicator buffers. What the indicator shows : a thin band and the upper number in front of the currency shows the relative strength index for the last N hours (N is set in the parameters in the variable 'Hours'), a wider band shows the daily index. The more currency pairs using
FREE
This is a linear indicator of a currency power having the ability to filter by smoothing values. It shows the current power of selected currencies (the maximum number is 8), as well as historical values. Calculation depends on the selected chart timeframe the indicator is launched at. The indicator displays data as lines for all currencies or as a histogram for the current currency pair. The intersection of the currency strength indices for the current currency pair is additionally displayed as
The uniqueness of this indicator lies in the volume accounting algorithm: accumulation occurs directly for the selected period without reference to the beginning of the day. The last bars can be excluded from the calculation, then the current data will have less influence on the significant levels (volumes) formed earlier. For a more accurate calculation, data from the M1 graph is used by default. The step of distribution of price volumes is regulated. By default, the right border of the display
CPM Extended
Sergey Efimenko
4.6 (20)
The algorithm is based on the idea of the Currency Power Meter indicator. In this version, the number of displayed values is unlimited, its code is more compact and fast, values of the current bar can be obtained through indicator buffers. What the indicator shows : a thin band and the upper number in front of the currency shows the relative strength index for the last N hours (N is set in the parameters in the variable 'Hours'), a wider band shows the daily index. The more currency pairs using
FREE
Extended version of the "Keltner Channel" indicator. This is an analytical tool that allows you to determine the ratio of the price position relative to its volatility. You can use 26 types of moving average and 11 price options to calculate the middle line of the indicator. Configurable alerts will notify you when the price touches the upper or lower border of the channel. Available average types: Simple Moving Average, Exponential Moving Average, Wilder Exponential Moving Average, Linear Weig
The indicator displays harmonic patterns on the chart based on Dynamic ZigZag ( https://www.mql5.com/en/market/product/5356 ) and is almost a complete analog of one of the versions of well-known korHarmonics. The indicator recognizes the following patterns and their varieties: ABCD, Gartley (Butterfly, Crab, Bat), 3Drives, 5-0, Batman, SHS, One2One, Camel, Triangles, WXY, Fibo and Vibrations. Only display of ABCD and Gartley patterns is enabled in the settings by default. The reverse line allows
This is an MTF indicator of support and resistance levels based on Advanced ZigZag Dynamic and/or Extended Fractals indicator extremums with price labels (can be disabled). More higher TFs can be selected for MTF mode. By default, the levels are generated based on ZigZag indicator dots. Fractals indicator dots can also be used together with ZigZag or instead of it. In order to simplify the use and save CPU time, calculation is performed once per each bar at its opening. Parameters: ForcedTF - ch
The indicator shows harmonic patterns on the chart without repainting with the minimum possible lag. The search for indicator tops is based on the wave principle of price analysis. Advanced settings allow you to choose parameters for your trading style. At the opening of a candle (bar), when a new pattern is formed, an arrow of the probable direction of the price movement is fixed, which remains unchanged. The indicator recognizes the following patterns and their varieties: ABCD, Gartley (Butter
The indicator allows you to determine the current price direction and market volatility. This version of the Traders Dynamic Index  (TDI) has the redrawing of the historical data eliminated, the algorithm calculation speed optimized, more external parameters for a more precise adjustments, and its functionalities extended: added the selection of the initial oscillator and the smoothing methods of the averages. Parameters: Mode Osc - estimation oscillator selection; Period Osc - the calculation p
Advanced Power Trend
Sergey Efimenko
5 (2)
Unique "scalping" trend indicator with the feature of multi-layered smoothing of the resulting lines and a wide selection of parameters. It helps determine a probable change in the trend or a correction virtually near the very beginning of the movement. The toggled intersection arrows are fixed and appear at the opening of a new bar, but, with enough experience, it is possible to look for entry opportunities as soon as the indicator lines intersect at the unfinished bar. The signal appearance li
The uniqueness of this indicator lies in the volume accounting algorithm: accumulation occurs directly for the selected period without reference to the beginning of the day. The last bars can be excluded from the calculation, then the current data will have less influence on the significant levels (volumes) formed earlier. For a more accurate calculation, data from the M1 graph is used by default. The step of distribution of price volumes is regulated. By default, the right border of the display
True SSRC nrp
Sergey Efimenko
5 (2)
The indicator shows (optional): Spearman's rank correlation coefficient, Pearson's linear correlation coefficient, Kendall's rank correlation coefficient, and Fechner's sign correlation coefficient. This oscillator shows the points of possible market reversal when the price goes beyond the overbought and oversold levels. There are 4 methods for additional filtering of the obtained values: simple, exponential, smoothed, linearly weighted. After the bar is closed, the values are fixed and not rep
If you trade by levels, then this indicator is for you. The indicator displays support and resistance levels for the selected timeframes, additionally showing how many points to the nearest levels, as well as between which levels the current price is in the form of a color scale and percentages. Location anywhere on the chart, the ability to scale, the calculation offset taking into account the hourly difference of your broker, the choice of colors and other parameters will allow you to cus
The indicator displays harmonic patterns on the chart based on Dynamic ZigZag ( https://www.mql5.com/en/market/product/5357 ) and is almost a complete analog of one of the versions of well-known korHarmonics. The indicator recognizes the following patterns and their varieties: ABCD, Gartley (Butterfly, Crab, Bat), 3Drives, 5-0, Batman, SHS, One2One, Camel, Triangles, WXY, Fibo and Vibrations. Only display of ABCD and Gartley patterns is enabled in the settings by default. The reverse line allows
This is an MTF indicator of support and resistance levels based on Advanced ZigZag Dynamic and/or Extended Fractals indicator extremums with price labels (can be disabled). More higher TFs can be selected for MTF mode. By default, the levels are generated based on ZigZag indicator dots. Fractals indicator dots can also be used together with ZigZag or instead of it. In order to simplify the use and save CPU time, calculation is performed once per each bar at its opening. Parameters: ForcedTF - ch
This is a linear indicator of a currency power having the ability to filter by smoothing values. It shows the current power of selected currencies (the maximum number is 8), as well as historical values. Calculation depends on the selected chart timeframe the indicator is launched at. The indicator displays data as lines for all currencies or as a histogram for the current currency pair. The intersection of the currency strength indices for the current currency pair is additionally displayed as
Unique "scalping" trend indicator with the feature of multi-layered smoothing of the resulting lines and a wide selection of parameters. It helps determine a probable change in the trend or a correction virtually near the very beginning of the movement. The toggled intersection arrows are fixed and appear at the opening of a new bar, but, with enough experience, it is possible to look for entry opportunities as soon as the indicator lines intersect at the unfinished bar. The signal appearance l
The indicator shows harmonic patterns on the chart without repainting with the minimum possible lag. The search for indicator tops is based on the wave principle of price analysis. Advanced settings allow you to choose parameters for your trading style. At the opening of a candle (bar), when a new pattern is formed, an arrow of the probable direction of the price movement is fixed, which remains unchanged. The indicator recognizes the following patterns and their varieties: ABCD, Gartley (Butter
The utility is designed to   change the symbol   of the current, all or selected charts,   change the timeframe , as well as to   synchronously move through the history   of all charts (automatically or by clicking the button). The list of symbols is read from the "Market Watch" or is set manually. The color, size and position of the buttons are customizable. Synchronization of charts occurs according to the time of the first visible bar when you press the "SYNC" button or when moving the mouse/
The indicator shows (optional): Spearman's rank correlation coefficient, Pearson's linear correlation coefficient, Kendall's rank correlation coefficient, and Fechner's sign correlation coefficient. This oscillator shows the points of possible market reversal when the price goes beyond the overbought and oversold levels. There are 4 methods for additional filtering of the obtained values: simple, exponential, smoothed, linearly weighted. After the bar is closed, the values are fixed and not rep
If you trade by levels, then this indicator is for you. The indicator displays support and resistance levels for the selected timeframes, additionally showing how many points to the nearest levels, as well as between which levels the current price is in the form of a color scale and percentages. Location anywhere on the chart, the ability to scale, the calculation offset taking into account the hourly difference of your broker, the choice of colors and other parameters will allow you to cus
Filter:
Леонид Кушнирук
31
Леонид Кушнирук 2017.03.01 02:20 
 

Как установить это чудо техники??

Купил.

Но он не скачивается и не активируется. Задолбался уже.

wrmjr
39
wrmjr 2015.09.18 16:16 
 

I can not set.....

Reply to review
Version 1.6 2020.03.25
Updating the code for the current version of the terminal.
Version 1.5 2016.02.09
Divided the common alert on touching the upper/lower channel line into two independent ones
Version 1.4 2016.01.22
Optimized the averaging calculation algorithm.
Added 5 new types of smoothing.
Slight changes to the "appearance" of the parameters.
Added toggled Alerts (Warnings) when touching the upper and the lower lines of the channel, new parameters:
AlertOnUpDnTouch - enable/disable alerts in general
EnableAlertMessage - enable/disable text messages
EnableAlertNotification - enable/disable push-notifications to mobile devices
EnableAlertSound - enable/disable sound alert
AlertSoundFileName - sound file name for the alert
Version 1.3 2014.12.16
Fixed data update when downloading missing bars.
Version 1.2 2014.10.16
Fixed shifting and calculation of dependent moving averages when the number of bars on chart decrease.
Version 1.1 2014.09.12
Minor optimization of calculations.