Fisher Reversals
- Indicators
- Jean Francois Le Bas
- Version: 1.0
- Activations: 20
This indicator weigth the actual close price with the high and the low of past values
then it is computed by a simple 1 lag IIR filter before being processed by a final logarithmic algorithm to order the data.
This Indicator is perfect to find precise reversals.
Rules of Trading :
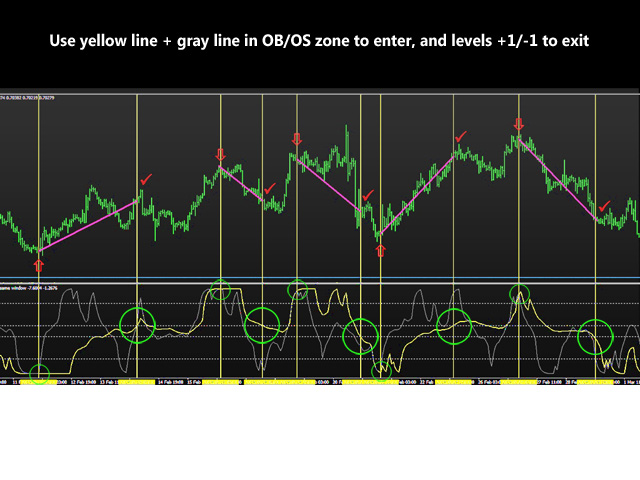
1) Be sure that the yellow line is in overbought/oversold (above +5 or under -5)
The higher/lower, the better.
2) Wait for the gray line to touch the yellow line then separate from it : this is the signal.
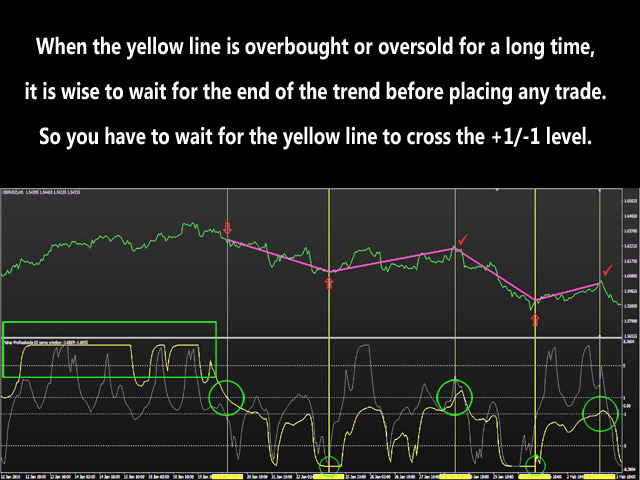
3) If the yellow line is in Overbought/Oversold area for quite some time, it means we are in a trend. Then it is wise to wait for the end of the trend before entering the next top/bottom reversal. To that effect, it is better to wait for the yellow line to cross the +1/-1 level before entering the next reversal.
Targets are defined when the yellow line crosses the +1/-1 levels (please refer to screenshots).
Parameter description
- len1 (default 130) = period of the yellow line.
- offset1 (default 0) = allows computations to be offseted by a positive or negative amount
- len2 (default 13) = period of the gray line.
- offset2 (default 0) = allows computations to be offseted by a positive or negative amount
Yellow line : this is the Trend line
Gray line : this is the Action line.

