Predictor of the bars
- Indicators
- Maxim Romanov
- Version: 1.3
- Updated: 24 March 2020
Indicator Description
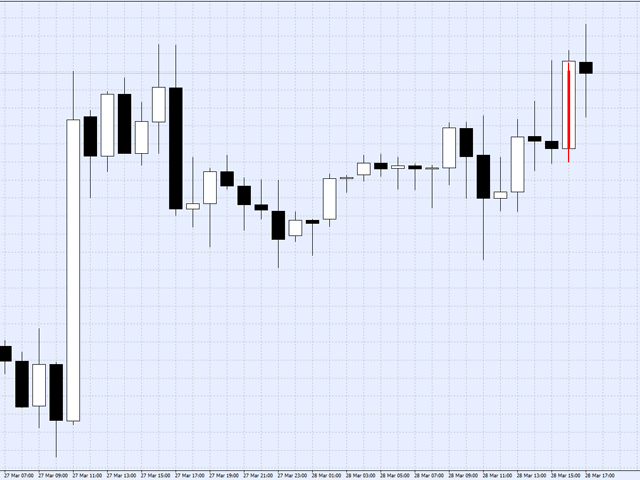
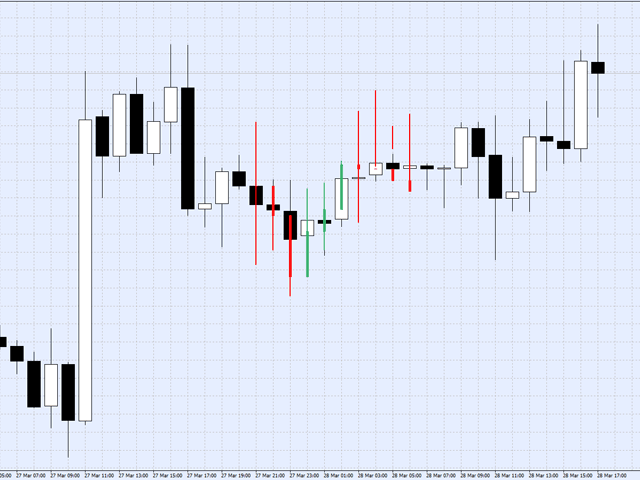
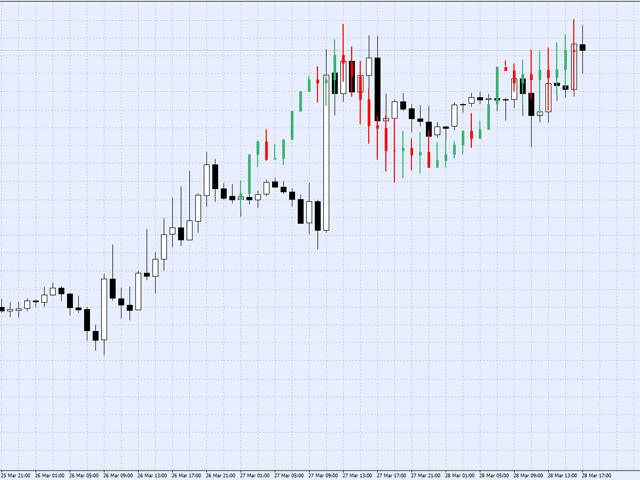
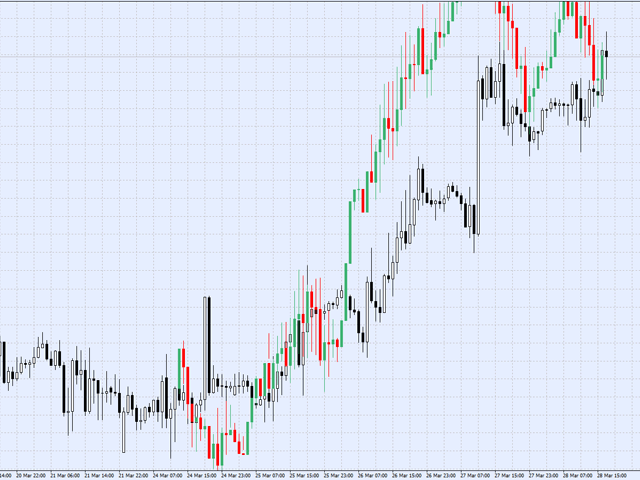
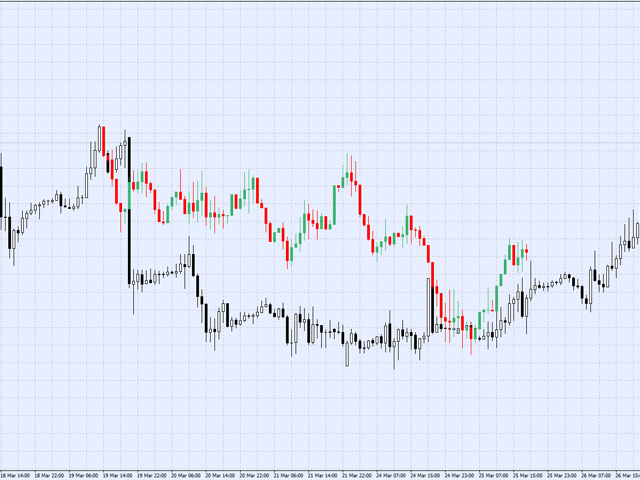
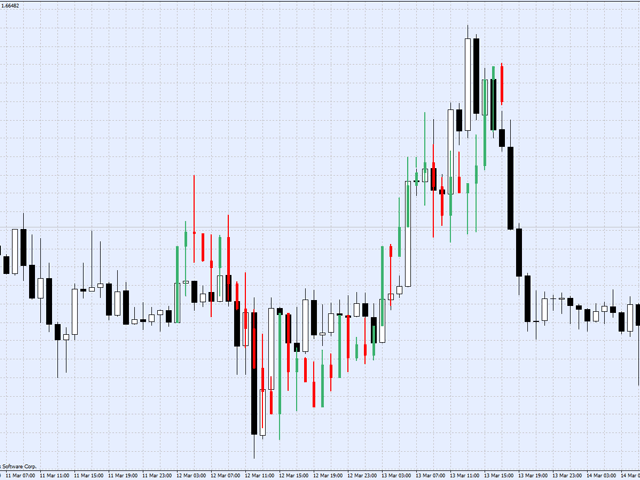
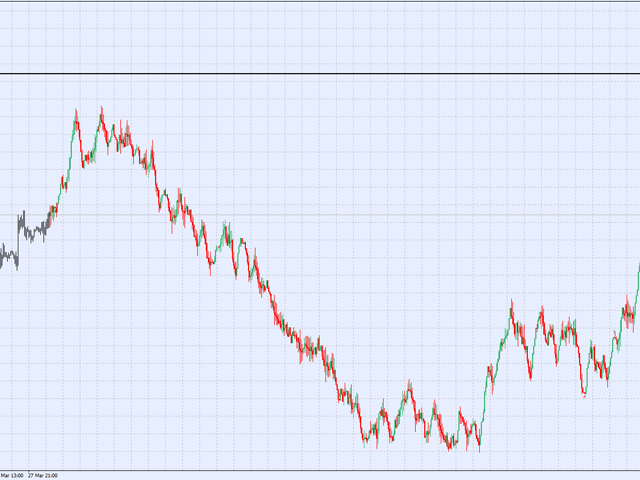
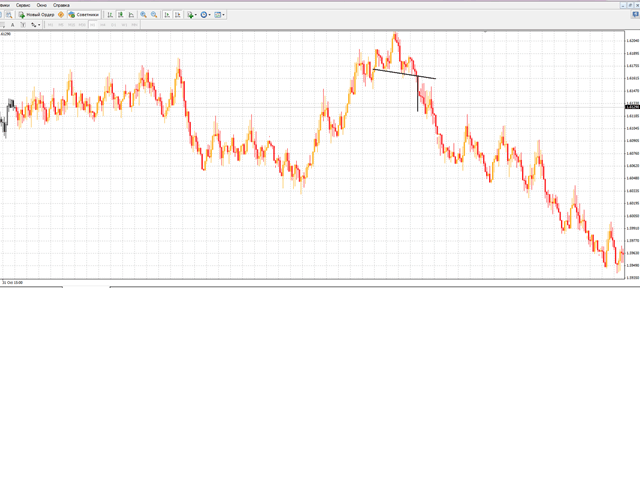
This is a one-of-a-kind indicator. It predicts future bars using the theory of cyclical behavior of prices and certain market stationarity. This indicator will help you predict 1 or more future bars, thus providing a picture of the possible development of the market situation.
It is based on 5 prediction methods. The first method is the Fourier transform, while the other ones are represented by different variations of linear prediction methods. You can select which method will be used. The analysis is performed using historical data, whereby the more data is involved, the more accurate the prediction. The Fourier transform offers the highest accuracy but requires great calculation resources, which sometimes makes its use impractical.
If you need to analyze a big amount of data (>1000), linear prediction methods would in this case be more appropriate as they are much faster. This indicator is peculiar in that instead of the price, the prediction methods use average price increments as inputs. In other words, the calculation of a single close value is based on open, high and low values, as well as the previous high and low. The same is true about other bar values.
The indicator enables you to not only predict the future price value but to also move the prediction start point by N bars back to the past to be able to select the best parameters for the current situation. With this indicator, you will have the opportunity to get a glimpse of the future and see the possible development of the situation, taking into consideration the existing relations between the previous and current prices. Apparently, many other processes occur in the market. They may be somewhat chaotic, and when combined with cyclical processes, distort the real picture of prediction. When cyclical processes prevail, the prediction is highly accurate. But when other processes dominate, it may not be so accurate any more.
So, you can use the indicator for the primary purpose of predicting the price movement, as well as to determine the processes that are currently prevalent in the market by the degree of similarity of the predicted movement with the actual one. After using this indicator, you will be surprised to see how predictable the market sometimes is.
Description of Parameters
- Method - prediction method (1- Fourier transform, 2,3,4,5 - linear prediction methods).
- LastBar - number of the bar that serves as a start point in prediction (0 - current bar; any other number - number of bars back in the past).
- PastBars - number of bars to be analyzed (for the Fourier transform, it is recommended to use the value from 100 to 1000; a greater value will significantly slow down the calculation; for other methods, you can set the value of more than 10000, but you will have to wait for a long time).
- LPOrder - accuracy of prediction from 0 to 1 (used only in linear prediction methods).
- FutBars - number of bars to be predicted (it must be up to the PastBars value but ideally should be 2-3 times less).
- HarmNo - maximum number of frequencies for the Fourier transform (it is recommended to set it to 1/2 or 1/3 of PastBars; the value has a strong impact on the speed of calculations, whereby the greater the value, the slower the calculation. It must not be greater than PastBars ).
- FreqTOL - accuracy of prediction for the Fourier transform (the higher the accuracy, the slower the calculation. Recommended value - up to 0.00000001).
- FreqMax - maximum number of iterations for frequency reduction (it can be left unchanged).
- BurgWin - function for weighted averaging (for linear prediction methods; 0 = without weighted averaging, 1 = the Hamming method, 2 = parabolic method).
- P - increment averaging period (for H1, the recommended value is 12, for М30 =24, M15 =48, for М5 =60; you can set it to 1 and also get good results, so feel free to experiment).
- TF - time frame on which the indicator is running (specified in minutes, for H1=60).
- s1="High=(Hoh+Hhl+H3)/3" - data for calculation of the High value (at least 1 must be enabled).
- Hoh_= true.
- Hhl_=true.
- H3_=true.
- s2= "Low=(Lol+Lhl+L3)/3" - data for calculation of the Low value (at least 1 must be enabled).
- Lol_=true.
- Lhl_=true.
- L3_=true.
- s3="Close=(Coc+Chc+Clc)/3" - data for calculation of the Close value (at least 1 must be enabled).
- Coc_=true.
- Chc_=true.
- Clc_ =true.
Operation Principles
Calculations may take from a fraction of a second to several minutes or tens of minutes and even days, depending on the depth of history involved in the analysis. If the terminal stops responding, it means that the calculation is in progress and you have to wait. The indicator never causes the terminal to hang and will ultimately complete the calculation. Please do not set more than 3000 bars for the analysis using the Fourier transform (or more than 20000 for other methods), as it will significantly slow down the operation. If you want to perform a deep analysis, set a big TF value, e.g. 240, otherwise the calculation will never be completed as the prediction is recalculated on every new bar.





As time goes by , it seems to get quite reliable.Well done