Exit Area Ultimate MT5
- Indicators
- Thushara Dissanayake
- Version: 1.0
- Activations: 20
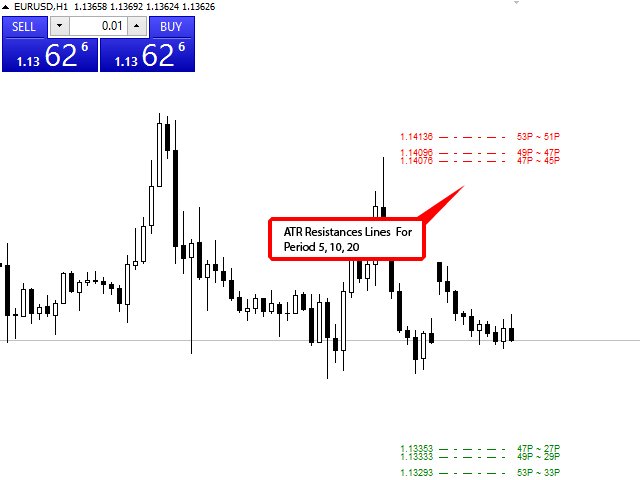
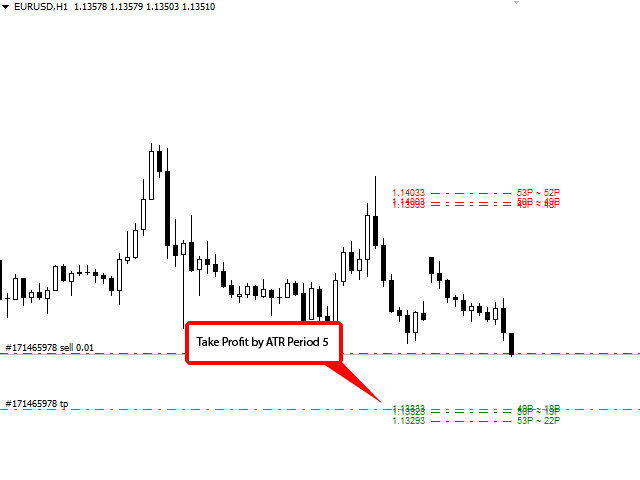
The Exit Area Ultimate is a technical indicator designed to enhance trading decisions by indicating the daily Average True Range (ATR) and Average Daily Rate (ADR) levels on the chart. By understanding these levels, traders can easily assess the average movement of an asset throughout the day. This versatile indicator serves multiple purposes for day traders, aiding in order placement, identifying intraday tendencies, setting trailing stop loss levels, and establishing daily take profit levels.
One of the key features of this indicator is its reliance on the ATR and ADR indicators, which provide valuable insights into market volatility and price range. Traders can use this information to determine appropriate take profit and stop loss levels, optimizing their risk management strategies. The indicator also calculates the remaining pips based on the indicated levels, allowing for quick assessment of potential profit or loss.
The Exit Area Ultimate is compatible with every symbol, enabling traders to apply it to a wide range of assets. Additionally, each indicator level can be activated or deactivated based on individual preferences and trading strategies. Traders have the flexibility to customize the indicator levels according to their specific requirements.
To ensure timely notifications, the indicator offers mobile, email, and pop-up alerts, allowing traders to stay informed about important market developments. These alerts can be quickly configured and customized to suit individual preferences.
In terms of parameters, the Exit Area Ultimate provides various settings for ATR and ADR. Traders can adjust the averaging periods and choose whether to display the ATR and ADR levels on the chart. The indicator also offers common filters, such as a multiplier for the ATR/ADR, as well as alert filters to control the frequency of notifications.
Graphical parameters allow for visual customization of the ATR and ADR lines, including line colors, styles, and widths. This enables traders to personalize the indicator's appearance on the chart, making it more intuitive and visually appealing.
Overall, the Exit Area Ultimate is a comprehensive and user friendly indicator that empowers traders with essential information about market volatility and daily price ranges. Its features, such as customizable indicator levels, notification alerts, and visual customization options, make it a valuable tool for traders seeking to optimize their trading strategies and achieve better risk management.
Parameters
- ATR Parameters - Customize ATR indicator.
- ADR Parameters - Customize ADR indicator.
- Common Filters - Customize common indicator conditions.
- Alert Parameters - Customize alerts for specific conditions.
- Graphic Parameters - Customize visual appearance and colors.