MTF Supply Demand Zones
- Indicators
- Georgios Kalomoiropoulos
- Version: 2.5
- Updated: 26 July 2024
- Activations: 20
AMAZING OFFER --> Activations from 5 to 20 for "MTF Supply Demand Zones" and "Automated Trendlines"
If you get the MTF Supply Demand Zones you can join the" Trade Like Me " Video Series. It contains 14 Live Sessions where i am placing trades on Forex, Stocks, Indices and Metals.
You will be able to see how i am evaluating setups and how i manage my trades. You can send me a DM and i will give you access to the service.
TWO TYPES OF ALERTS --> 1)WHEN PRICE HITS A ZONE 2)WHEN A NEW ZONE IS FORMED
You don't get one more useless indicator. You get a complete Trading Strategy with Proven Results.
New Features:
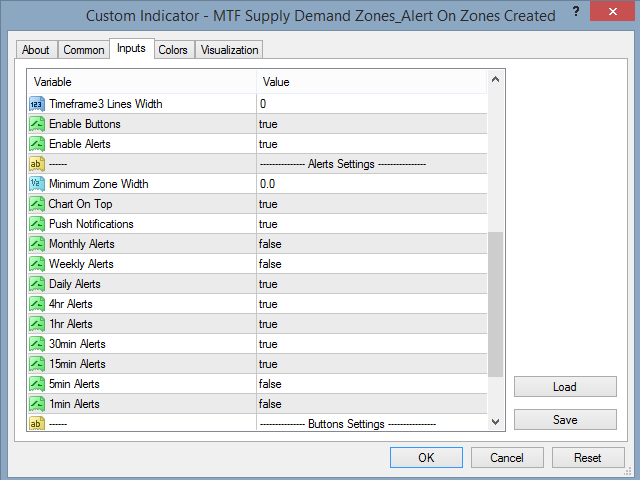
Alerts when price hits Supply/Demand Zone
Alerts when a new Supply/Demand Zone is created
Push notifications alerts
Zone width labels in pips
One more timeframe on MTF. So now instead of 2 timeframes above the current you will be able to see 3 timeframes above the current
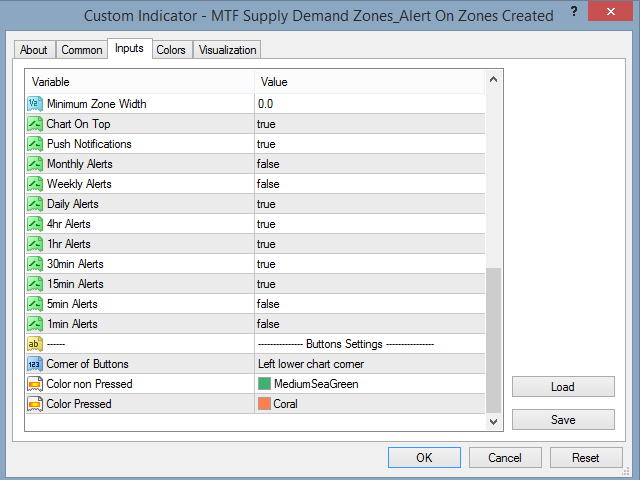
Buttons to enable/disable the Alerts/Zones/MTF functions
Advantages You Get :
Remove emotions from your trading.Objectify your trading entries.
Elevate your profits taking high probability setups.
Save time from drawing zones.
Trade financial markets like a professional.
Instant multitimeframe analysis of any market.
What You See On Chart?
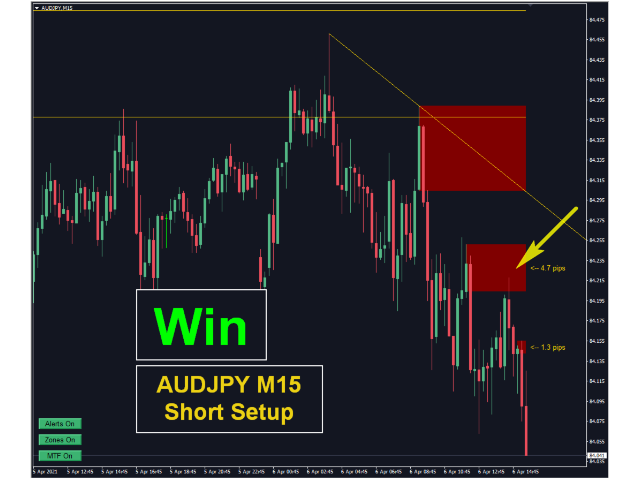
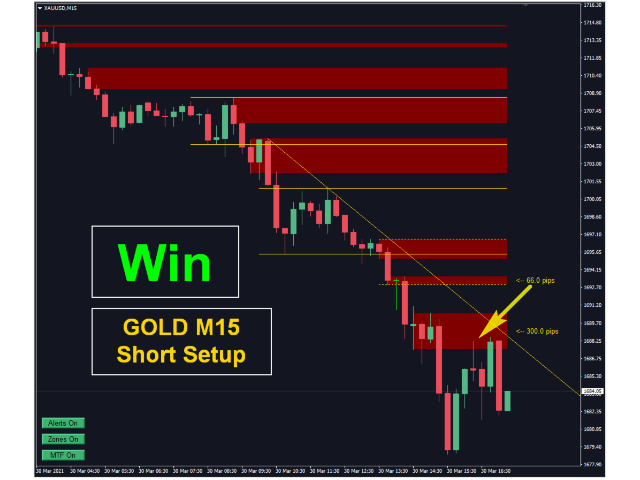
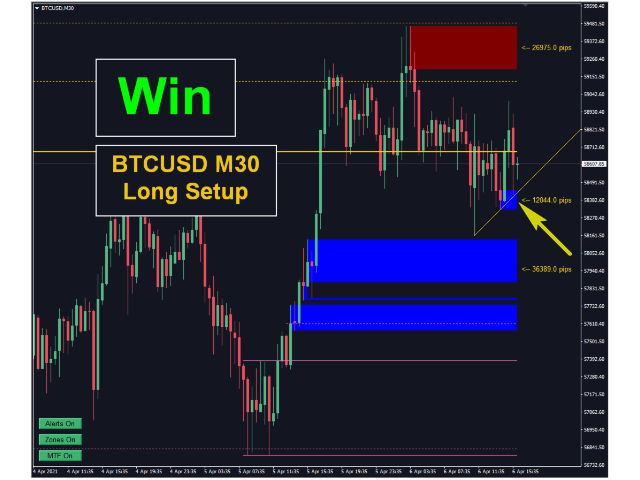
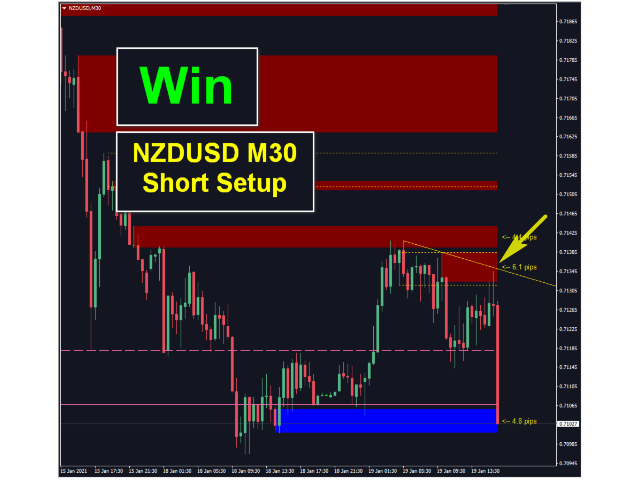
The Blue and Red Rectangles are the Supply and Demand Zone of the Current Timeframe.
The Dotted Style lines are the Supply and Demand Zones from 1st Timeframe above Current.
The Solid Style lines are the Supply and Demand Zones from 2nd Timeframe above Current.
Also you have the possibility to see the Supply and Demand zones from 3rd Timeframe above Current.
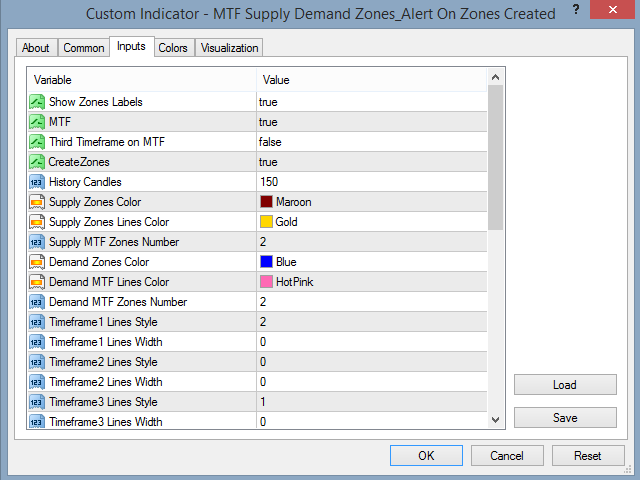
You can change the rectangle's color and the Style/Width of the lines from Indicator's Input Parameters.
Is This indicator The Same With Other Supply and Demand Indicators?
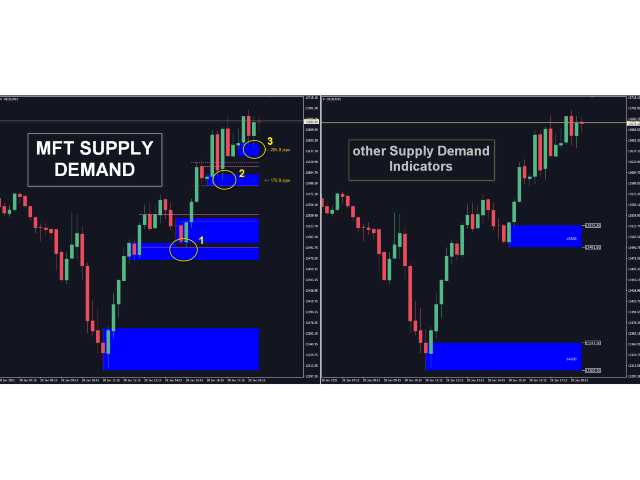
No,this indicator is not just an enhancement of the preexisting free indicator.The way that this indicator creates the zones is different from all the other supply and demand indicators of the market.
It is a completely new tool. You can check the photos below.
Main Differences from other Supply and Demand Indicators:
1. MTF Automated SD Zones indicator is multitimeframe indicator. From the current chart you can see the zones of the two upper timeframes.For example if your current chart is 1hr you can see the Supply/Demand zones of 4hr and daily timeframes.2. The algorithm is completely new and it was created from scratch. You can see zones that are not even drawn with other indicators.The zones are more accurate and you can find better entry points.
3. All zones are being created dynamically according to the price action of the market. That means that zones are changing their width according to market dynamics.
4. It is designed by professional trader for newbies and experienced traders that want to take their trading to the next level.
If you need any further information on how to use this indicator to take your trading to the next level i would be glad to help you.
All you have to do is to send me a Personal Message on my Profile.










Best S&D indicator on the market, accurate, the alerts work across all instruments and the support has been quick and responsive, thankyou!