IntraWeek Activity
- Indicators
- Serhii Shevchuk
- Version: 1.0
If your strategy requires trading during a certain period of market activity - calm or turbulent, this indicator will help you find such periods of time within a week for each currency pair using statistics.
The principle of the indicator is quite simple.
The entire trading week, from Monday 00:00 to Friday 23:59, is divided into timeslots, the duration of which corresponds to the current timeframe.
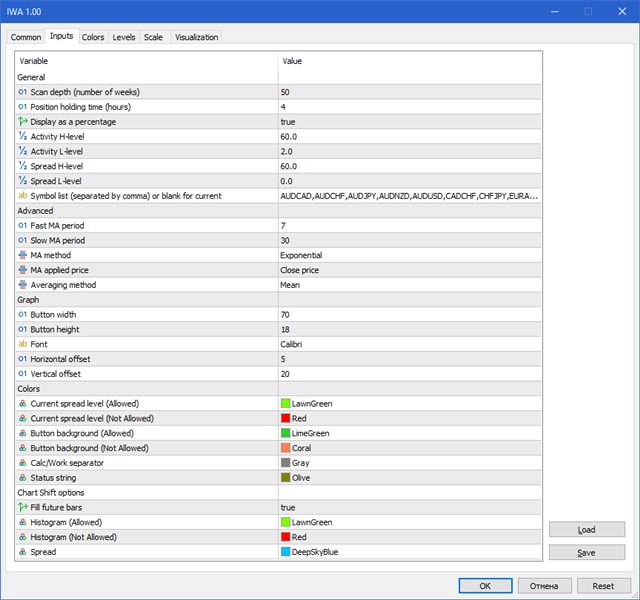
For each timeslot, activity is calculated - the average value of the difference between the slow and fast moving average over time, which is determined by the "Position holding time" parameter.
Further, the timeslot values are averaged over a given number of weeks (the "Scan depth" parameter).
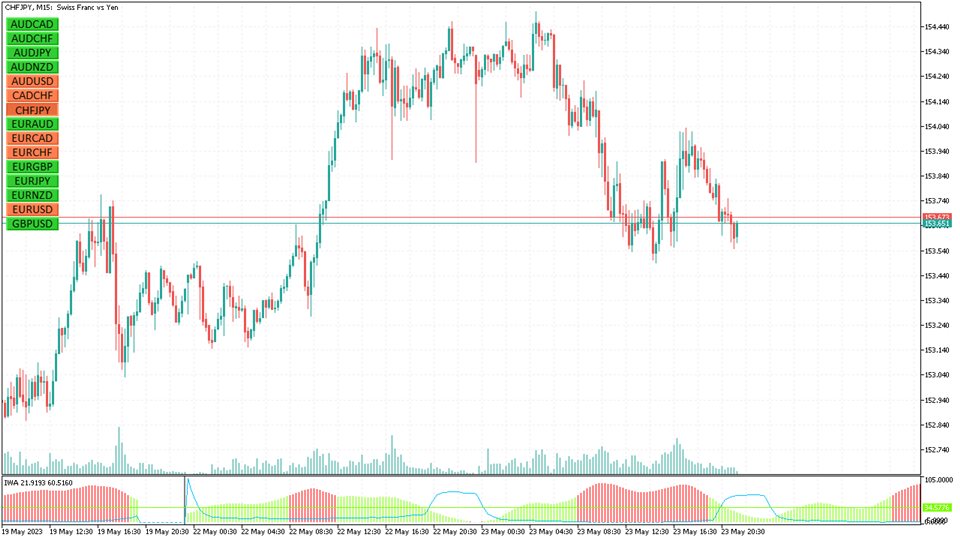
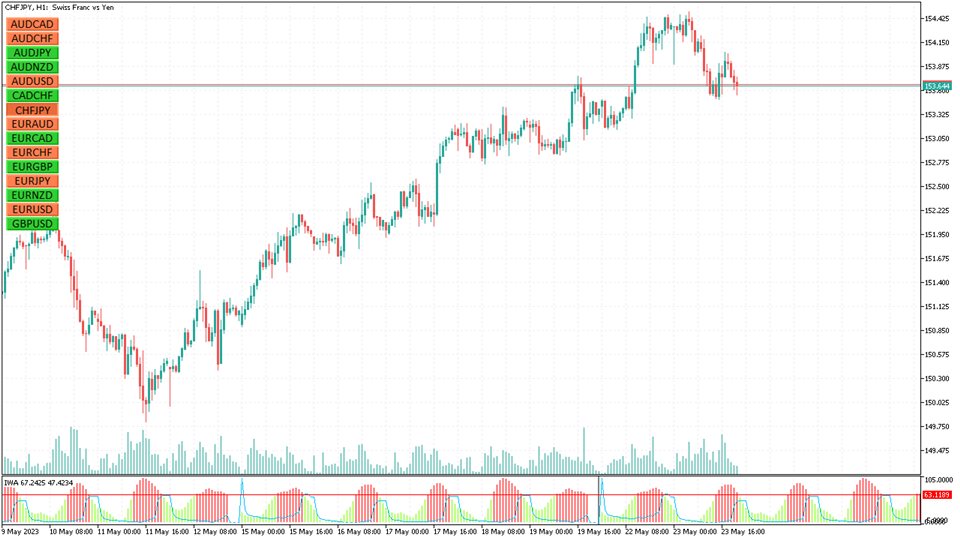
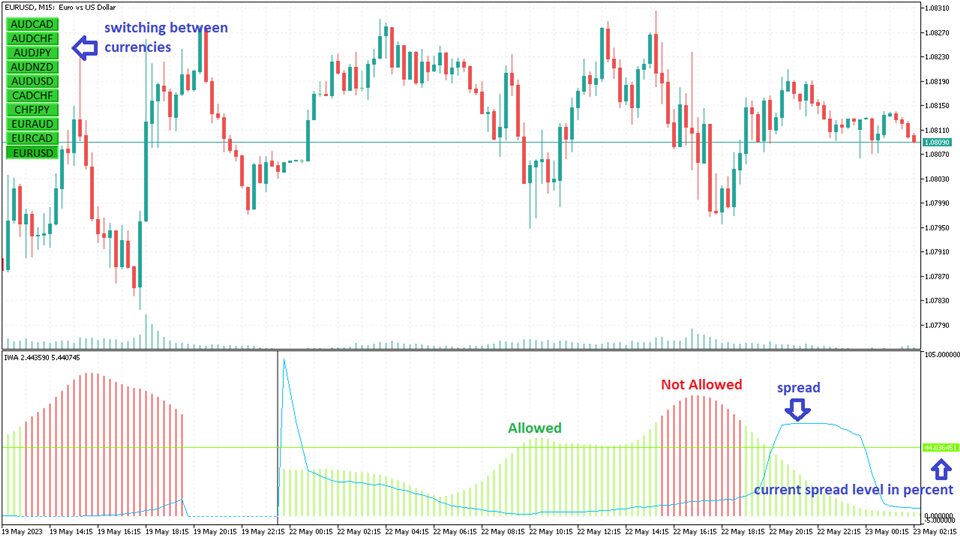
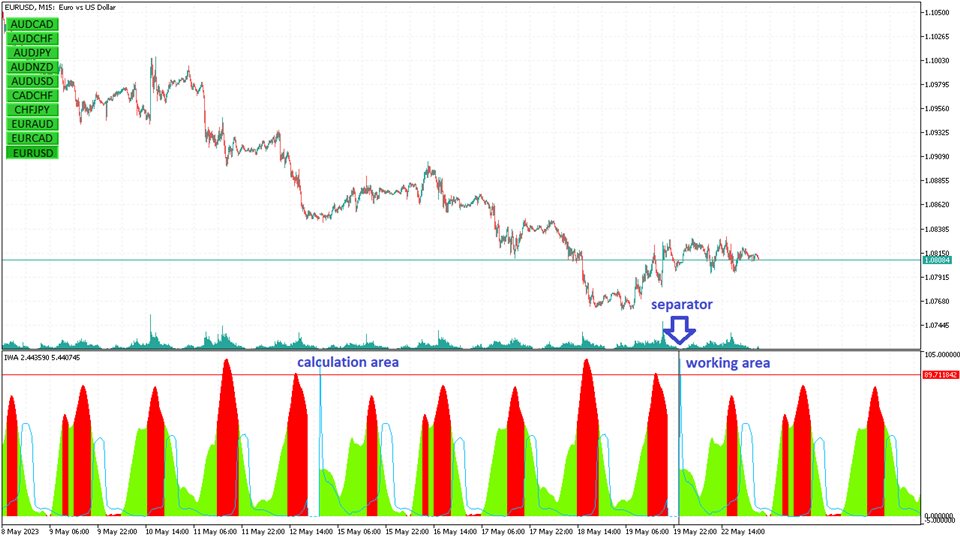
The average values are displayed as a histogram in the indicator window.
The spread is processed in the same way. First, for each timeslot, the average spread over the "position holding time" is calculated. Then, the average value over the weeks is calculated.
The spread is also displayed in the indicator window, but as a line.
This statistic helps us to see at what time of the week the market is calm and at what time it is not. Also, intra-week changes in the spread are visible.
To highlight the desired range of activity values, set the L-level and H-level values. Those values of the histogram that fall within the specified range will be colored in the "Allowed" color.
Levels can also be set for the spread. In this case, if both parameters are in the "allowed" range, then the corresponding button will be highlighted with the "allowed" color. Therefore, you can always see which of the currency pairs are currently suitable for trading and switch to them.
Important: if L-level is less than H-level, then the allowed range is from L-level to H-level (internal range). If L-level is given more than H-level, then the range of allowed values is the union of the two ranges, from 0 to H-level, and from L-level to the maximum (outer range).
Activity and spread values can be presented both in absolute and percentage form. In percentage display, the value 0 corresponds to the minimum value of the parameter (activity or spread), and the value 100 corresponds to the maximum. Percentage display is more convenient to use if you use several currency pairs.
The recommended timeframe is М15. It should be noted that when using a timeframe less than M5, a lot of calculations will be performed due to a large number of timeslots, which can take a long time. When using the W1 timeframe and more, the indicator algorithm loses its meaning, the values cannot be calculated.
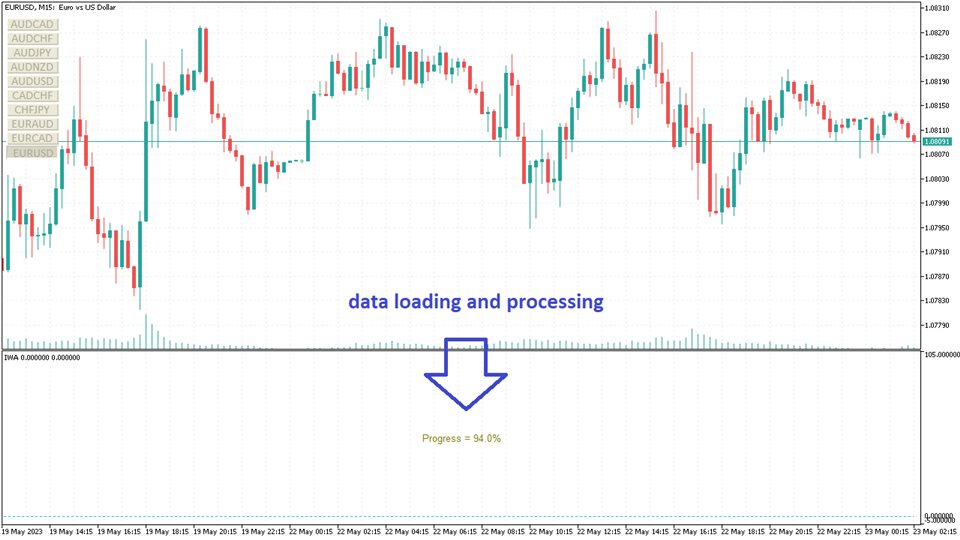
Statistics are recalculated when changing the trading week. This process may take several seconds, during which time a progress bar will be displayed in the indicator window.
The separator in the indicator window separates the calculated part (on the left) from the working part (on the right). During the calculation part of the graph, statistics are collected, the working part is not involved in the calculations.
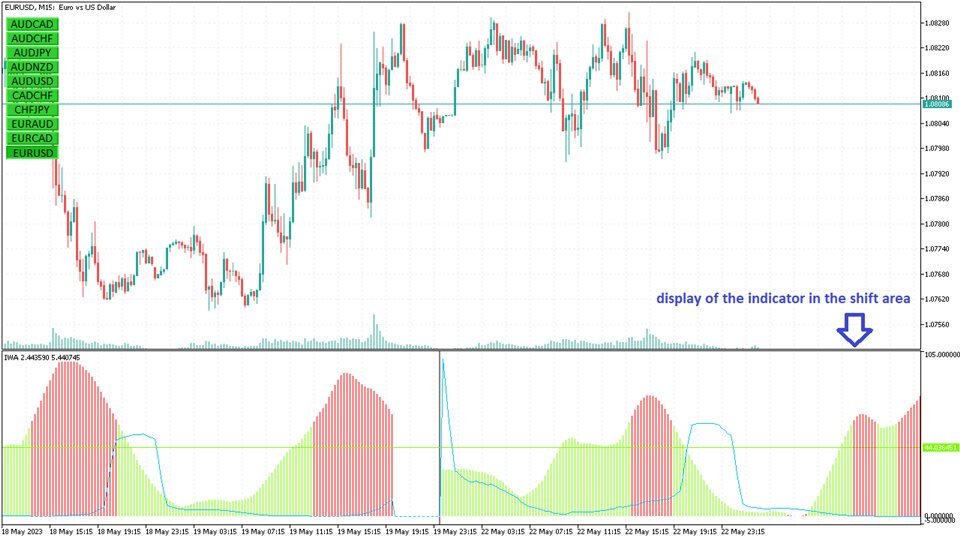
If you use chart shift from the right edge (recommended), the indicator will be displayed in the shift area as well. This makes it easier to see what values are expected next.
Most of the indicator functions work in the Strategy Tester. Only switching between symbols does not work. This means that you can almost fully test the demo before buying.
Note:
- If the "position holding time" parameter is equal to zero, then the values of moving averages and spread for one bar are included in the calculations.
- If you have the message "waiting for ticks" for a long time, select the "update" item in the context menu.
- If the progress bar is frozen at one value, this indicates that the necessary history is missing. Try decreasing the scan depth or increasing the period.

