Elliott WAVE Manual Marking Tool
- Indicators
- Andrei Chian
- Version: 2.11
- Updated: 7 October 2021
- Activations: 5
Most of those who trade in Forex are aware of the Elliott Wave Analysis System. So what is this wave analysis: This is the study and analysis of price, and not its derivatives (various indicators); The ability to determine price targets using Fibonacci tools (Elliott waves are closely related to Fibonacci numbers). You can get a clear picture of the market at all time scales; With EWA, it is possible to build a trading system with a clear description of the inputs and outputs.
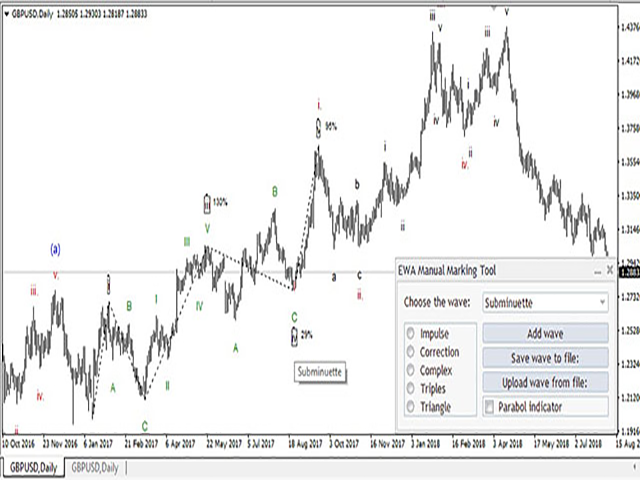
For simplicity, the marking of waves offer you an indicator for marking the waves of Elliot. The user needs only to select the wave level, select the wave type and add waves by clicking on the vertices of the graph.
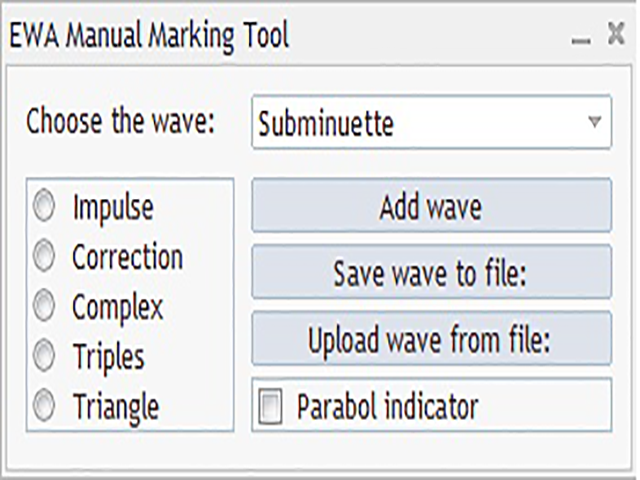
First, select the level of the waves using the mouse or the numbers on the keyboard 0..9.
Select the wave type with either the mouse or Impulse (I - button) 12345, Correction (C - button) ABC, Complex (Y - button) WXY, Triples (Z - button) WXYXZ, Triangle (T - button) ABCDE.
After clicking Add wave or Insert, the program is ready to start marking, after clicking, you can place labels on the chart.
After installing the waves, selecting the wave label, you can change their property by changing only one label, wave labels can be moved.
When selecting the waves and pressing the L button, displays the lines between the waves.
When selecting the waves and pressing the K button, displays the channels between the waves.
When selecting the waves and pressing the [ or ] button, increases or decreases the waves degree.
Hovering a wave label displays the percentage ratio of the waves, namely wave 3 to wave 1, wave 5 to wave 3, wave 2 and 4 to waves 1 and 3.
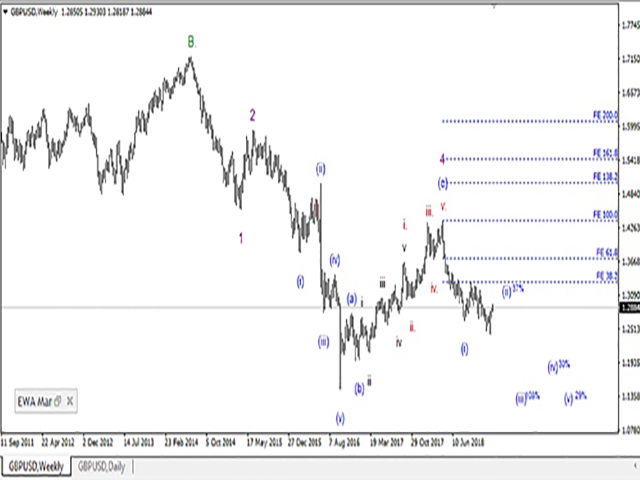
When selecting the waves and pressing the F button Fibo levels are projected.
The ESC button deselects all objects on the chart.
The DELETE button deletes all selected objects on the chart.
Save wave to file - saves the wave marking of the graph to a file and, if necessary, can be loaded onto another graph.
Upload wave from file - uploads waves to the chart.
Parabol indicator (Button P) - The indicator calculates the polynomial regression on a certain number of bars, calculates the standard deviation of the price from the regression line on the same range and with Fibonacci coefficients. The degree of regression (RegressDegree) allows you to display a hyperbolic channel. Linear deviation channel KNLDev, allows you to set the multiplier to the deviation.
How to interpret: If the channel is bent and crosses the uptrend from top to bottom, this is a signal to deplete the trend, we should expect a correction or a change in direction. With a downtrend with exactly the opposite.
I am sure that the indicator will speed up the wave layout on the chart at times. It will also help not to lose it - by saving to a file.


