High Trend Lite
- Indicators
- Evgeniy Scherbina
- Version: 1.14
- Updated: 4 May 2020
The indicator High Trend Lite monitors 5 symbols in up to 3 timeframes simultaneously and calculates the strength of their signals. The indicator notifies you when a signal is the same in different timeframes. The indicator can do this from just one chart. Therefore, High Trend Lite is a multicurrency and multitimeframe indicator.
High Trend Lite uses emproved versions of popular and highly demanded indicators for calculating its signals.
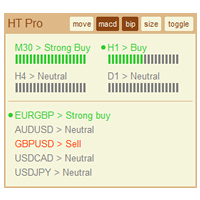
High Trend Lite calculates the signal strength for the 5 symbols simultaneously. Click the symbol button in the indicator interface to quickly access its signal strength in all selected timeframes (up to 3 timeframes).
It is recommended to open a trade when a signal has been confirmed by at least 2 timeframes. The indicator then notifies that it has found a Super buy or a Super sell.
Other signals pulled by the indicator are: Strong buy, Buy, Strong sell, Sell, Neutral or Loading.
These signals may change quickly, especially in the lower timeframes. That is why a strong signal is the one confirmed by at least 2
timeframes.
The indicator can notify about a strong signal with a sound bip.
How to use this indicator
1. I recommend using 2 timeframes - H4 and D1.
2. Your signal should be a Super buy or a Super sell as a result of these 2 timeframes going one direction.
3. A signal should be at the start of the lowest timeframe, so for the first 1-2 hours of the H4 timeframe. If you see a signal at 3-4 hour of the H4 timeframe, you should pass it and see if it is still confirmed in the next period. This confirmation is now possible because a signal may develop for 2 periods, so one signal in the first H4 and same signal in the next H4.
4. Be careful with your profit. For example, USDCHF can make 50 (500) pips for one move. While many symbols based on GBP can make as much as 150
(1500) pips.
Indicator Properties
Fontsize - choose a different font size to fit the indicator text to your screen resolution.
Timeframe 1
Timeframe 2
Timeframe 3
Comments to buttons in the chart
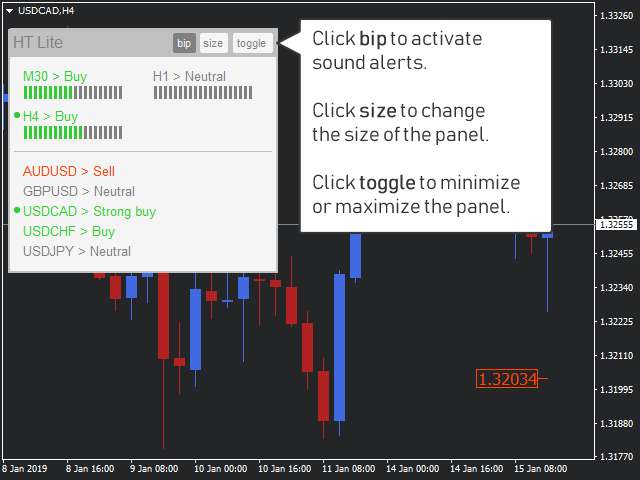
bip - switches on a sound alert.
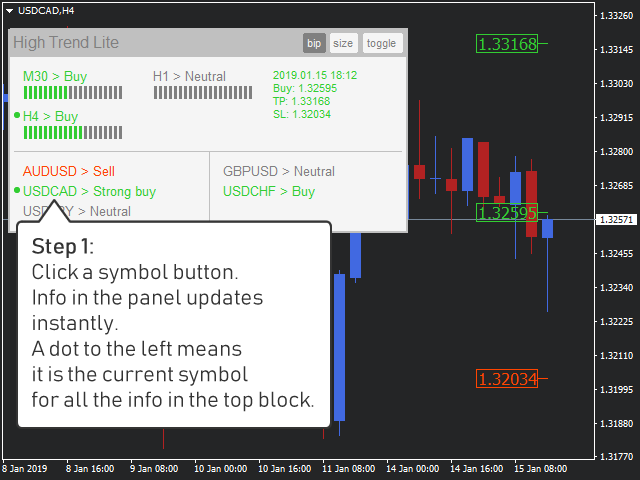
size - changes the panel size. An extended panel shows prices of a strong signal in the top right corner and its target price levels.
toggle - toggles the panel.
Click any symbol in the panel to show the information for all timeframes in the top. A dot on the left means that the top shows information for this symbol.
Click any timeframe in the top to switch to the chart of that symbol and timeframe. A dot on the left means that it is the current chart and
timeframe.
















signal not so good