WindFlow HTF MT5
- Indicators
- Carmine Pinto
- Version: 2.10
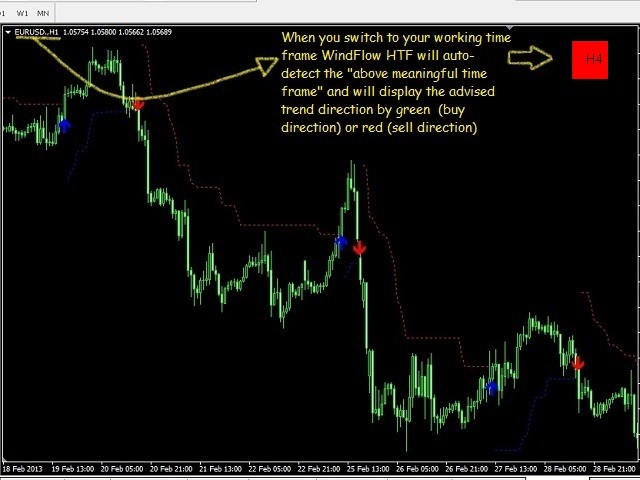
WindFlow HTF is a useful tool suited to use in conjunction together with my WindFlow indicator. This indicator will give you a background vision about the price action trend on a higher timeframe, so when it runs with the WindFlow indicator you have an almost complete trading solution. At this point, you only need some support/resistance analysis and a bit of focus to become a consistent trader.
The metaphorical "wind's ballet"
Professional traders know that every timeframe is governed by its own “above meaningful timeframe” but at the same time this higher timeframe is driven by its own lower timeframe in an inner fashion; this means that the higher timeframe will be late on the momentum moves than its lower timeframe but at the same time when the move occurs on the higher timeframe it is a meaningful move. This is a bit like the “wind's ballet” where different directional flows are mixed to form turbulence or quiet moments but when the quiet is too long and strange, sooner or later there will be a huge storm! I studied these concepts for years and they never cease to fascinate me: market's operators are behaving like the nature's forces, this is an awesome concept! Also, if you know Fibonacci (alias Leonardo Pisano, an Italian mathematician genius) he discovered a sequence which very often occurs in nature just like in the financial markets.
Now, one question arises: why traders (especially newbies) often have hard time to be consistently profitable? Well, many times (almost always), this happens because they are not aware of the market type; is it ranging or trending? Is it quiet or volatile? Capability to spot the correct market type is vital for your work as a trader just like the ground's conditions are vital for race cars success! "Expecting the same system to work in all market types is the definition of insanity" this is the sentence by a great market's psychologist Van Tharp in "Market Wizards" financial book.
Main Features
- Based on WindFlow trend's dynamics (without momentum/volatility calculation but only meaningful trend direction)
- Very useful for technical analysis
- Works on every symbol and timeframe
- Optional use of “above meaningful timeframe” auto-detection or manual timeframe choice
Inputs
- period: indicator's period
- strength: indicator's strength
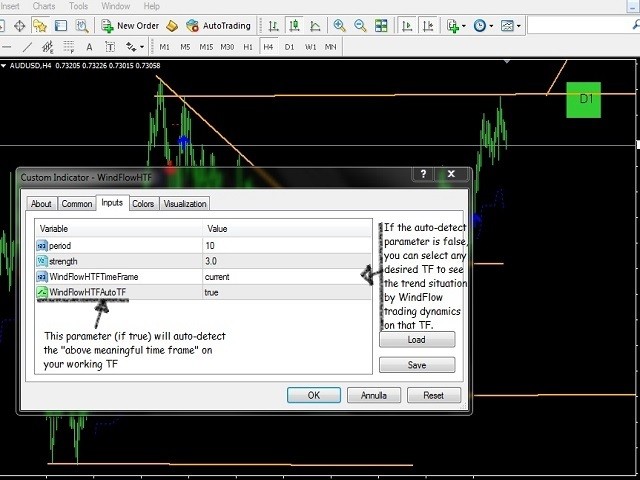
- WindFlowHTFTimeFrame: allow selection of your desired TF to show trend dynamics (if WindFlowHTFautoTF is false)
- WindFlowHTFautoTF (true/false): enble or disable the auto-detection of the "above meaningful timeframe"
- LoockBackBars: how many bars it look back for calculations (100 by default is enough to have correct calculations)