General Pivot Points Calculator
- Indicators
- Roy Meshulam
- Version: 1.0
- Activations: 5
Introduction
Professional traders use pivot points as support/resistance levels or as an indicator of a trend. Basically, a pivot point are areas at which the direction of price movement can possibly change. What makes pivot points so popular is their objectivity as they are recalculated each time the price moves further.
The pivot points indicator implements 5 popular pivot points calculation and drawing:
- Standard – The most basic and popular type of the pivots, each point serve as an indicators of possible trend reversal or continuation.
- Woodie -like the standard pivot points but more weight is given to the close price of the previous period.
- Camarilla – Set of eight very probable levels which resemble support and resistance values for a current trend.
- Tom Demark’s – A popular method of calculating pivots to forecast the future price of the current trend, the results are the predicted low and high of the period.
- Fibonnaci – Popular Fibonacci pivot points are determined by first calculating the floor pivot points and then multiplying with the 38.2%, 61.8% and 100% retracements.
Usage
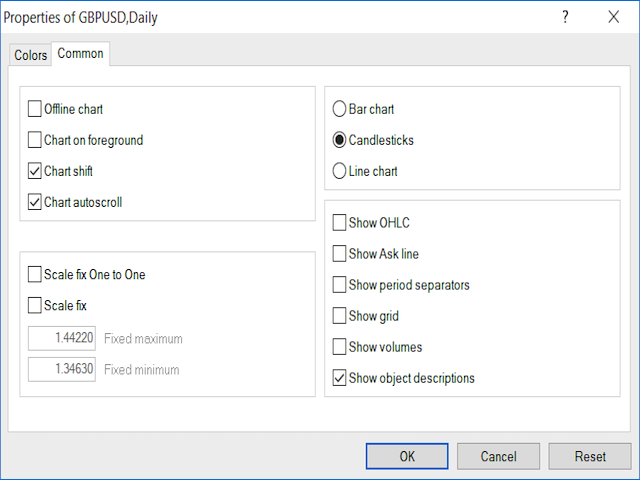
- Right click the chart and select “Show object descriptions” under Common properties.
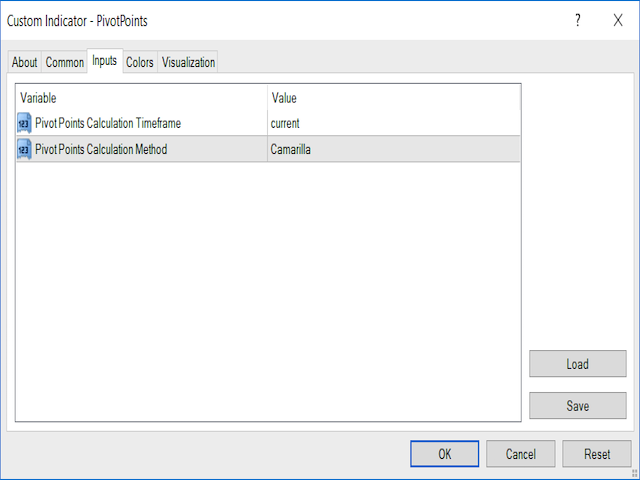
- Attach the indicator to the chart and select the timeframe and calculation method you want to use.
- The indicator will calculate the pivot points and draw them as lines which will get updated depending on the timeframe you chose.
© 2019 Roy Meshulam

