Strategy Builder
- Indicators
- Pavel Shutovskiy
- Version: 3.5
- Updated: 27 May 2020
- Activations: 20
Strategy Builder
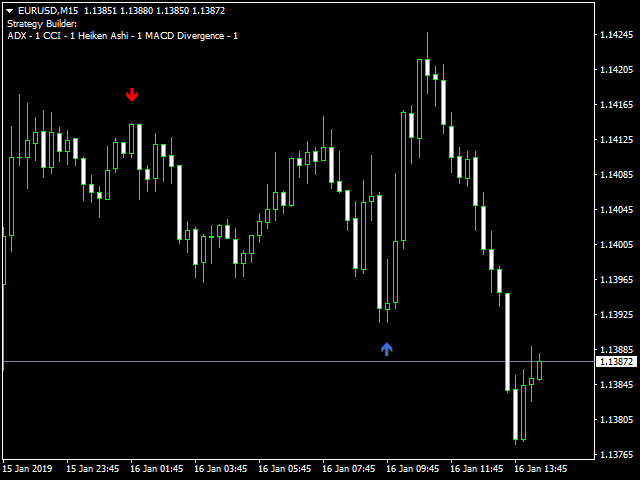
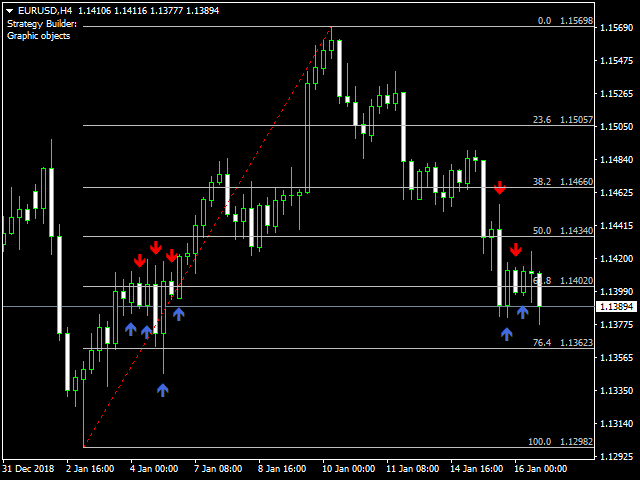
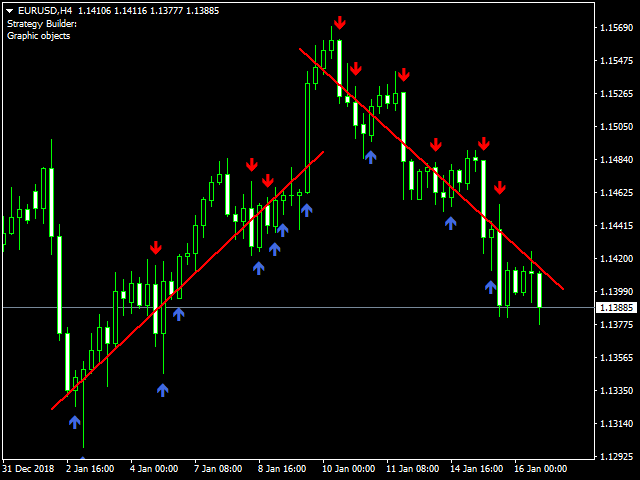
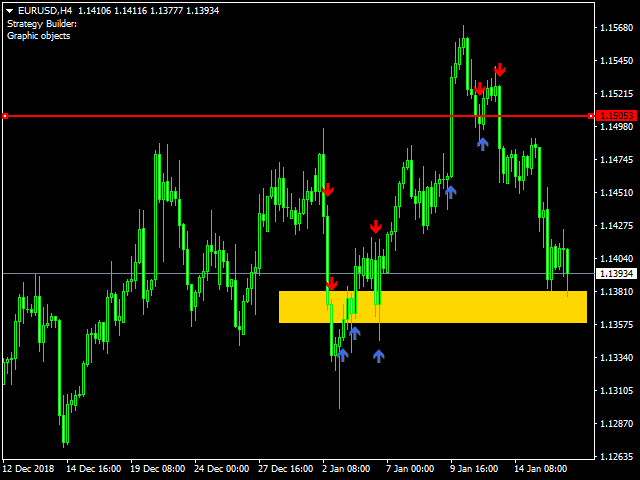
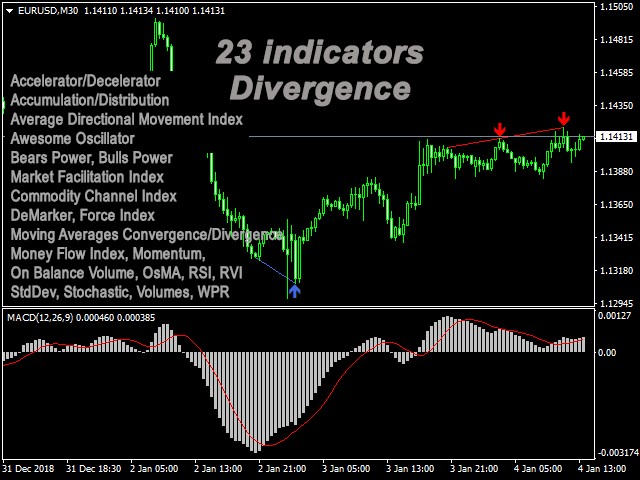
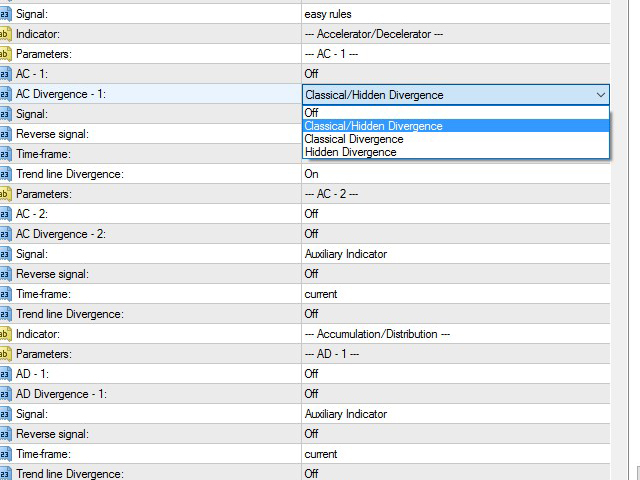
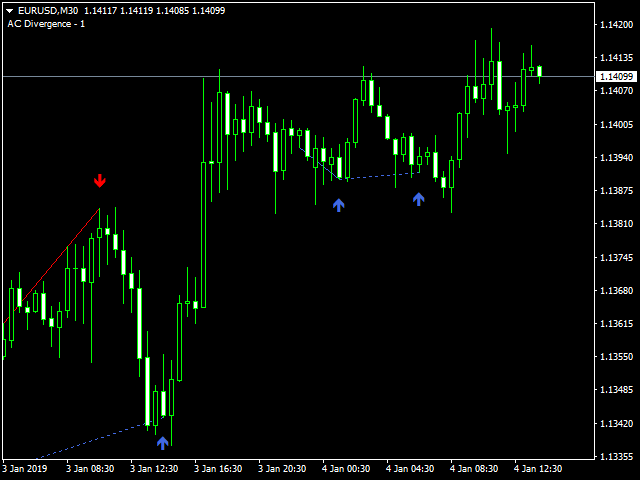
The Strategy Builder indicator allows you to create classic and individual strategies without loading the chart with a large number of indicators and without tracking many different indicators to identify the true signal. Strategy Builder displays signals in the form of arrows on 30 standard indicators, 23 indicators showing classical and hidden divergence, receiving signals from Fibonacci levels, horizontal, trend lines and rectangle. With the help of this indicator, you can receive signals from one indicator, as well as from several indicators by selecting the main and auxiliary indicators as a filter in the settings.
Indicator type: Trend, Oscillators, Channels, Levels, Multi-timeframe, Volumes.
The indicators are duplicated, so it is possible to get the readings, for example, RSI from different timeframes, it is possible to receive signals when crossing the lines (Crossing) on 13 indicators.
Indicators:
- AC - Accelerator/Decelerator + Divergence
- AD - Accumulation/Distribution + Divergence
- ADX - Average Directional Movement Index + Divergence
- Alligator
- AO - Awesome Oscillator + Divergence
- ATR - Average True Range + Divergence + Crossing
- Bands - Bollinger Bands®
- Bears Power + Divergence
- Bulls Power + Divergence
- BWMFI - Market Facilitation Index - Divergence
- CCI - Commodity Channel Index + Divergence + Crossing
- DeMarker + Divergence + Crossing
- Envelopes + Crossing
- Force Index + Divergence + Crossing
- Fractals
- Gator Divergence
- Heiken Ashi
- Ichimoku - Ichimoku Kinko Hyo
- MA - Moving Average + Crossing
- MACD - Moving Averages Convergence/Divergence + Divergence
- MFI - Money Flow Index + Divergence + Crossing
- Momentum + Divergence + Crossing
- OBV - On Balance Volume + Divergence
- OsMA - Moving Average of Oscillator + Divergence
- RSI - Relative Strength Index + Divergence + Crossing
- RVI - Relative Vigor Index + Divergence + Crossing
- SAR - Parabolic Stop and Reverse system
- StdDev - Standard Deviation + Divergence + Crossing
- Stochastic Oscillator + Divergence + Crossing
- Volumes + Divergence
- WPR - Larry Williams' Percent Range + Divergence + Crossing
- ZigZag
- Graphic objects (horizontal, trend lines, rectangle, Fibonacci levels)
Parameters:
- Notification -enable notifications
- Comment - to display a comment about the included indicators
- Arrow Up - Font characters Wingdings for signal-up
- Arrow Down - Font characters Wingdings for signal down
- Bars - The number of bars in the history to display indicator's signals
- Reverse - Reverse signals from all indicators
- Signal - Select the method of the signal formation when using several indicators: strict rules-signals will be formed when several indicator signals coincide on one bar. easy rules-signals will be formed according to the rule of the indicator filter and the main indicator
All parameters are published in the discussion.
Calling the indicator in EA is limited by the number of iCustom input parameters to receive signals: the indicator must be set on the chart, signal reception is possible using the GlobalVariableGet function
an example of a function of receiving signals in EA:
int IndicatorSignal(){
   if(GlobalVariableGet("Strategy Builder " + _Symbol + " " + (string)_Period) == 1.0) return 0; // sinal UP

   if(GlobalVariableGet("Strategy Builder " + _Symbol + " " + (string)_Period) == 2.0) return 1; // signal DOWN

   return -1;
}













Amazing Service - I was having trouble setting it up and Pavel very quickly sent me 3 different "set" files to load into the indicator and it is doing what it's supposed to do. Definitely worth it.
UPDATE: Having a little concern at the moment since after testing this product much more intently. If you are okay with repainting programs, then this is for you. I am currently using it in the most basic of forms and just wanted to know when the Main Line crosses the Signal Line when above 80% or below 20% for a fast and medium setting in the same time frame. This is a definitive point in time when using a candle closed condition. However, after it shows this, it continues to move the "Suggestion" arrow as the chart "flat lines" and there is not much movement either way, removes the suggested trade arrow if it begins reversing on you, and then also moves the arrow down to the optimal point when it does finally go up in the direction originally shown.
In Conclusion, if you are sitting there at your charts, it typically will provide an alert at the correct time but, unfortunately it tries to make things look prettier than they really are by repainting to the perfect spot. I have put in a request to see if this failing feature of so many programs that can absolutely mess up a strategy can be deleted and based on that, we will look into adjust the star rating.
Dine