Ichimoku Cloud at a Glance
- Utilities
- Robofx Technologies LLC
- Version: 1.0
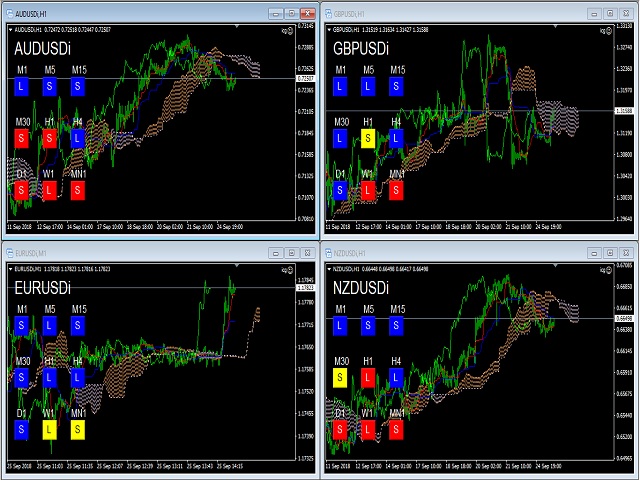
Ichimoku Cloud at a Glance (ICG) is an utility shows price vs cloud information for each timeframe at once.
It works with any timeframe. Drop it to any chart and you will see where the price is currently at relative to the each timeframe' cloud range. You can switch the timeframe in the middle of the operation as well.
There is a box and a letter under each timeframe caption.
Box color
- Blue : Price is above both Senkouspan A and B.(Above the cloud)
- Yellow : Price is at between Senkouspan A and B. (In the cloud)
- Red : Price is below both Senkouspan A and B. (Below the cloud)
Letter
- "L" : Senkouspan A is above Senkouspan B . (Momentum is likely to be long)
- "E" : Senkouspan A and Senkouspan B are at the same level. (No trend)
- "S" : Senkouspan A is below Senkouspan B. (Momentum is likely to be short)
Happy trading!
