Tic Tac Toe
- Indicators
- Andriy Sydoruk
- Version: 1.0
- Activations: 5
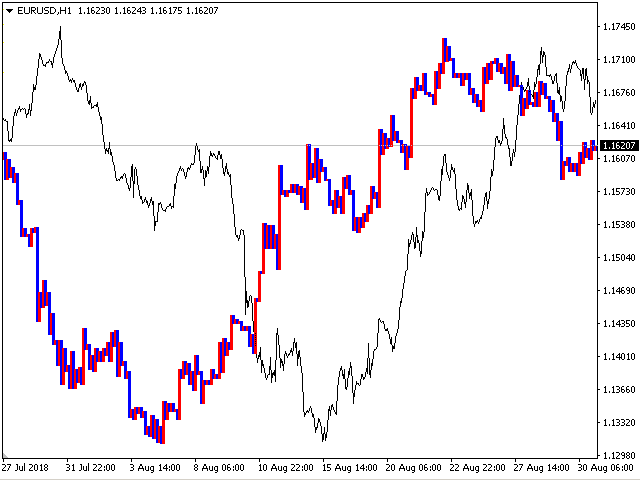
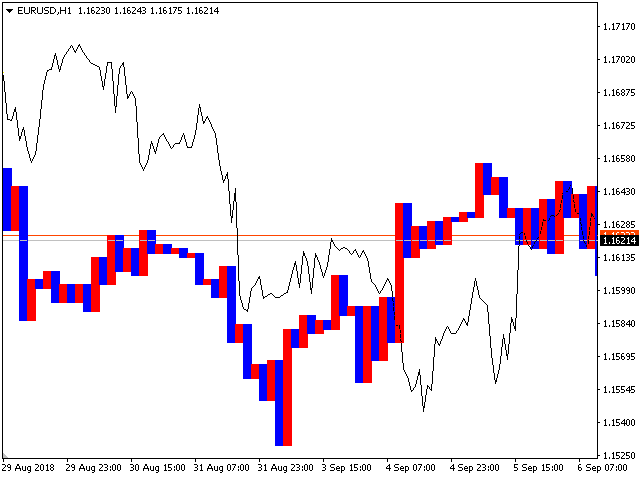
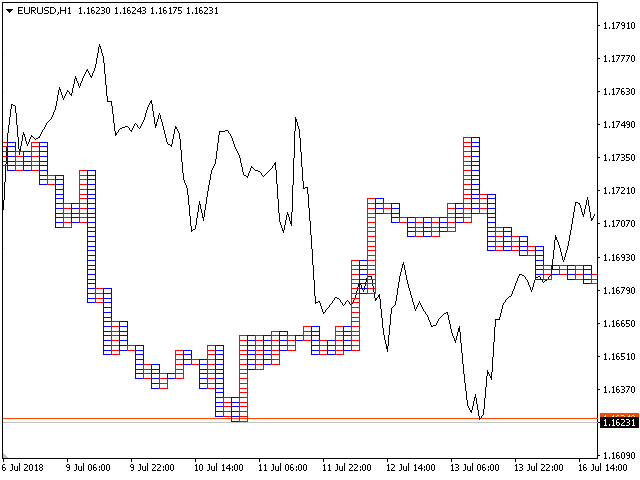
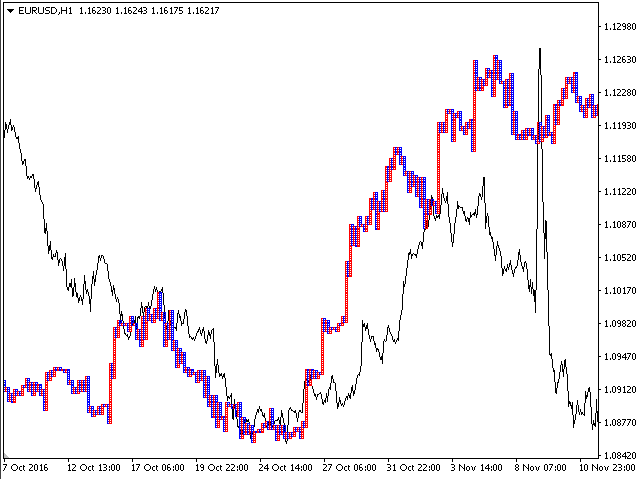
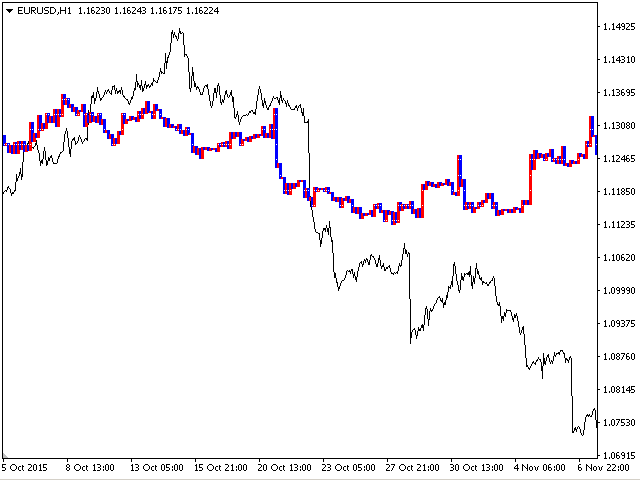
The algorithm of the Tic Tac Toe indicator differs from the usual indicators on the price charts in that it completely ignores the flow of time and reflects only changes in the price. Instead of displaying the time intervals on the X axis, and the price value on the Y axis, the Tic Tac Toe indicator displays price changes on both axes. The indicator displays in red if prices rise by a certain base value (TicTacToe) and blue if prices fall on the same value. If prices fell / rose by less than a certain base value, then nothing is drawn. A change of color means a change in the price trend. The indicator shows the points of potential market reversal (when two graphs intersect). And the place of the potential level of price return. The Tic Tac Toe schedule will always come close to the main price chart! Works on all currency pairs and on all timeframes. Simple, visual and effective use. The indicator is not redrawn and does not lag.
