Demark Trend Lines several time frames
- Indicators
- Vladyslav Goshkov
- Version: 1.1
- Updated: 4 February 2022
- Activations: 5
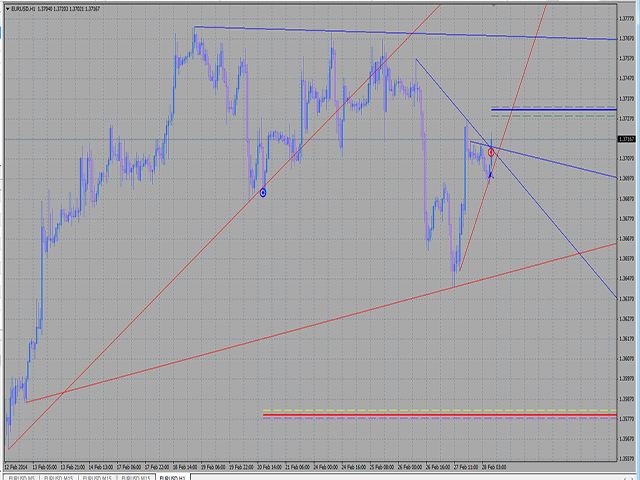
The indicator draws trend lines based on Thomas Demark algorithm.
It draws lines from different timeframes on one chart. The timeframes can be higher than or equal to the timeframe of the chart, on which the indicator is used.
The indicator considers breakthrough qualifiers (if the conditions are met, an additional symbol appears in the place of the breakthrough) and draws approximate targets (target line above/below the current prices) according to Demark algorithm.
Recommended timeframes for trading are D1+H1.
Trend lines for other timeframes may provide additional information for assessing the market situation.


