Candle GAP
- Indicators
- Thushara Dissanayake
- Version: 1.0
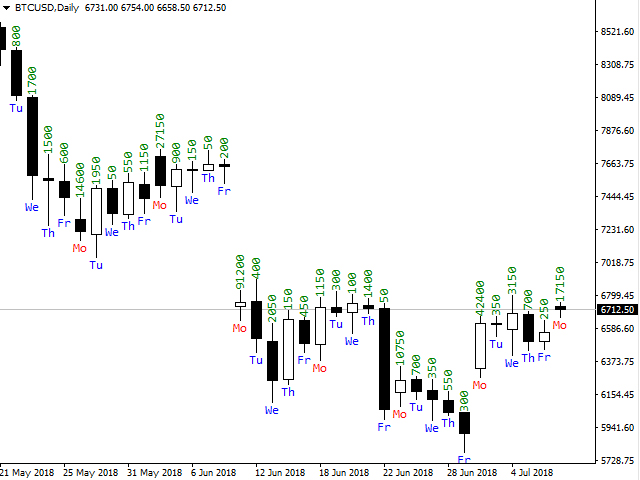
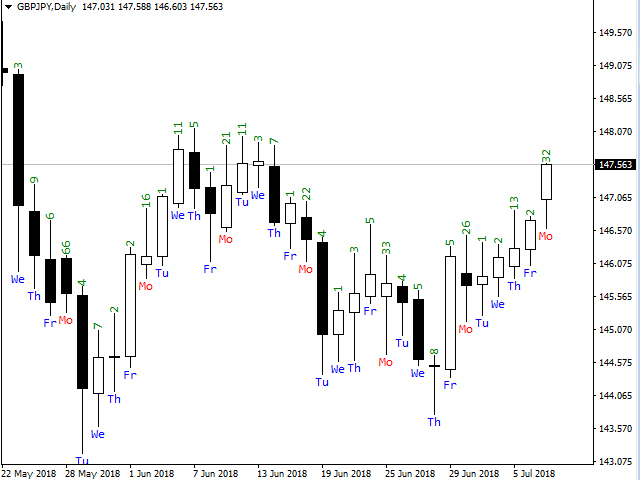
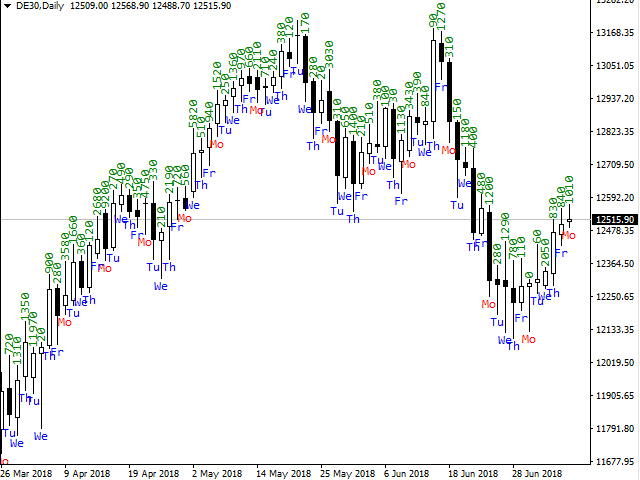
The Candle GAP indicator is an essential tool for traders utilizing Gap Trading Strategies as it automatically identifies candle gaps for each day of the week. A gap refers to a price level difference between the close and open of two consecutive days. This indicator recognizes four types of gap patterns: Common, Breakaway, Continuation, and Exhaustion. By incorporating this indicator into any chart, traders can validate their signals and enhance their trading decisions.
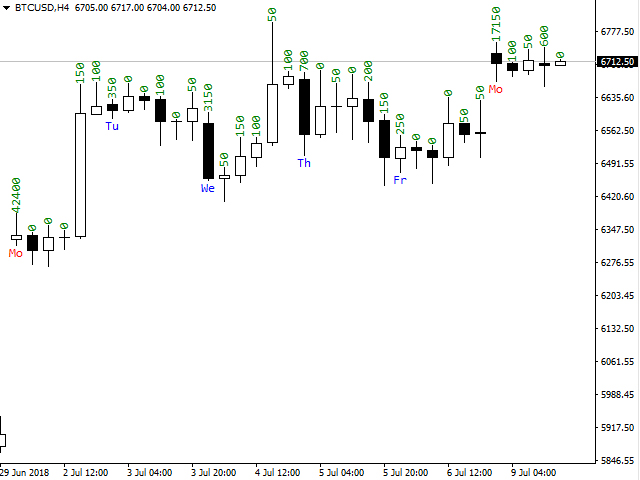
One of the key features of the Candle GAP indicator is its versatility, as it can be used with any timeframe under D1 (daily) and for any symbol or instrument. It offers easy to use parameters, making it accessible to traders of all experience levels. The indicator swiftly draws gap patterns on the chart, allowing for quick analysis and decision making. Its simplicity adds to its usability, ensuring a straightforward and efficient trading experience.
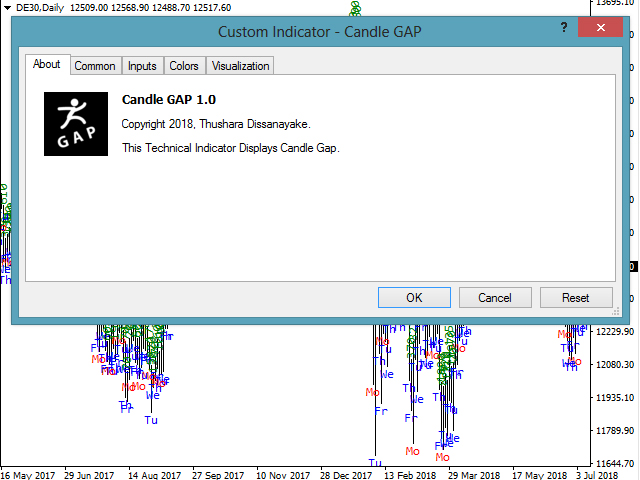
The Data Display Parameters of the indicator allow traders to customize the appearance of the gap information. Users can select the desired font family and size for displaying the text associated with each day of the week. Additionally, individual colors can be assigned to Monday, Tuesday, Wednesday, Thursday, and Friday, providing visual clarity and ease of interpretation.
Overall, the Candle GAP indicator serves as a powerful tool for traders seeking to capitalize on gap trading strategies. It facilitates the identification and confirmation of gap patterns, enabling traders to make informed trading decisions across various timeframes and symbols.
Parameters
- Data Display Parameters - Customize visual appearance and colors.













Not up to my taste