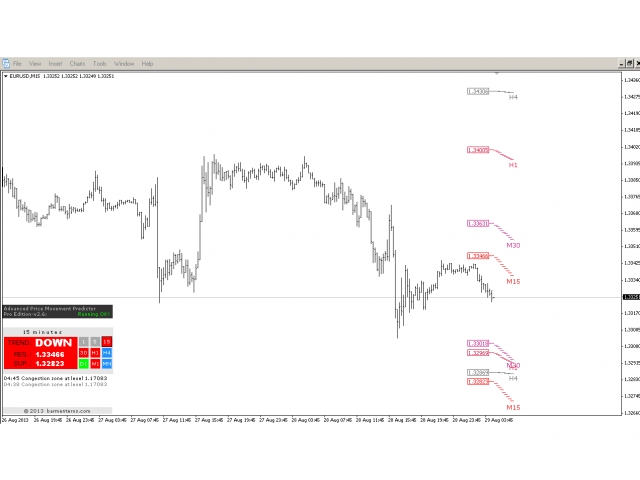
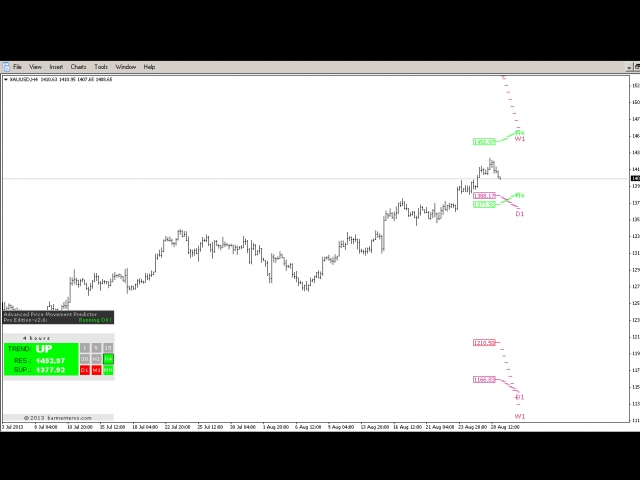
Advanced Price Movement Predictor Basic Edition 5
- Indicators
- Boris Armenteros
- Version: 3.0
- Updated: 29 November 2021
It predicts the most likely short-term price movement based on advanced mathematical calculations.
Features
- Estimation of immediate price movement;
- Calculation of the real market trend;
- Calculation of the most important support and resistance levels;
- Algorithms optimized for making complex mathematical calculations with a minimal drain of system resources;
- Self-adjusting for better performance, so it’s able to work properly at any symbol (no matter how exotic it is) and any timeframe;
- Compatible with any MetaTrader platform, regardless of the number of digits or other parameters;
- Compatible with any other tool (indicator, EA or script) without slowing down the terminal performance and the trading operations.
Note: for getting multi timeframe values, congestion zones and additional features you must use PRO version or MASTER version.
Introduction
Most of the classic indicators that make up the common trading strategies are based on simple math, not because when these indicators were created there were no outstanding mathematicians (in fact there were probably best mathematicians then than now), but because computers did not exist or they simply had a low processing power to perform complex mathematical operations consistently. Nowadays, any smartphone surpasses overwhelmingly the most powerful computer just a few decades ago. So the ability to process huge amounts of information is not a limitation in these days, except for extremely complex process simulations.
Advanced Price Movement Predictor (APMP) indicator takes advantage of current processing capacity to capture the essence of price swings through some of the most advanced mathematical, statistical and probabilistic concepts.
APMP does not provide a prediction itself, since the price movement is a non-stationary stochastic process and therefore it is not predictable. However, it makes a dynamic and highly reliable estimation of the immediate price movement.
Based on the same analysis, APMP displays the current real trend of
the market. Why real trend? Is not real the trend obtained with other
indicators? So far the trend is almost always obtained from classic
indicators like Moving Averages, Bollinger Bands or Parabolic SAR, or
simply by the traditional method of manually drawing a line (or two
parallel lines) between two or more significant points.
Obviously, those indicators and methods are still valid, especially since they are used by most of the traders, but do most of them obtain sustained profits? We have the intuition that they do not. With this indicator you can strengthen or improve your current trading method, or you can simply dismiss it because you will see that even the most chaotic behavior, such as the market price, respects the large numbers and is limited to the rigor of the all powerful mathematical laws.
How to Use It
Basically, the use of APMP is not different from how you regularly use trends, and support and resistance levels. The fundamental difference is in the reliability and robustness of those values calculated by this indicator.
Regular use of APMP is as follows:
For trading strategies based on the trend, traders must buy in areas near the support levels while the trend is up, and sell in areas close to the resistance levels while the trend is down.
For trading strategies based on trend corrections (counter trend), traders must buy in areas near the support levels while the trend is down, and sell in areas near the resistance levels while the trend is up.
Notice that significant levels can act either as supports or resistances, so it is important to keep that in mind when designing our trading strategy and pay special attention to the price behavior whenever it is close to those levels.
The Stop Loss could be located at a distance from the open price equal to the separation between the support and the resistance levels, and Take Profit distance could be twice the previous separation. Also, it would be a good idea to use a Trailing Stop feature to move the Stop Loss when support and resistance levels are moving in favor of the position.
The strategy outlined above is only a basic suggestion, but APMP provides enough information to create a variety of trading strategies and improve the existing ones.
It will be interesting to hear about different strategies derived from this indicator.
How It Works
APMP shows the following information:
- Support and resistance levels closest to the market price in the current timeframe and for the rest of higher periods.
- The real trend and the most probable short-term price movement in the current timeframe and for the rest of higher periods.
- Alerts when congestion zones appear and when the price crosses any of the important levels. Congestion zones are those where 2 or more levels coincide.
Users can also enable dialog box and email alerts. Both APMP and MetaTrader alerts are accompanied by beeps (audible alert). Moreover, all alerts are printed on 'Experts' tab to allow future reference and analysis.
About Us
We are a small team of coders/traders that provide professional programming services for the trading world, mostly for MetaTrader platform. Our team has around 7 years (as average) of trading experience and about 6 years (as average) dedicated to programming in MetaTrader. We have developed Scripts, Indicators and Expert Advisors for many clients around the world and for our own use, as it's the case of Advanced Price Movement Predictor (APMP) indicator.


Выглядит многообещающе. Понравилась простота настроек (их вообще нет) и однозначность предсказаний. Его не нужно "уметь читать". Он дает четкий прогноз. Чисто трендовый индикатор, не точка входа.