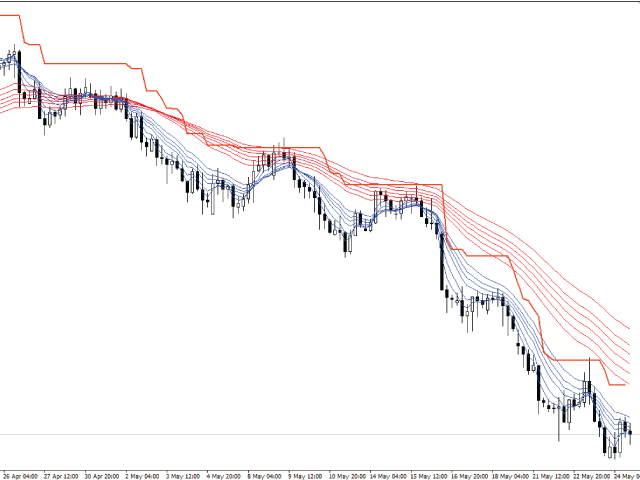
Ants Lite Traders ATR
- Indicators
- Guppytraders.com
- Version: 1.2
- Activations: 5
Ants Lite ATR allows you to enter and manage your trades based on the market volatility, giving you safer entries and better exits. Based on the work by Daryl Guppy.
Features
- Ability to define the bar the Long and Short calculation starts from.
- Can be used to generate both entry or exit signals.
- Customizable ATR period and multiplier.
- GMMA is a tried and tested indicator with a long pedigree.
- Volatility based entry and exit signal rather than time based.
How To Use
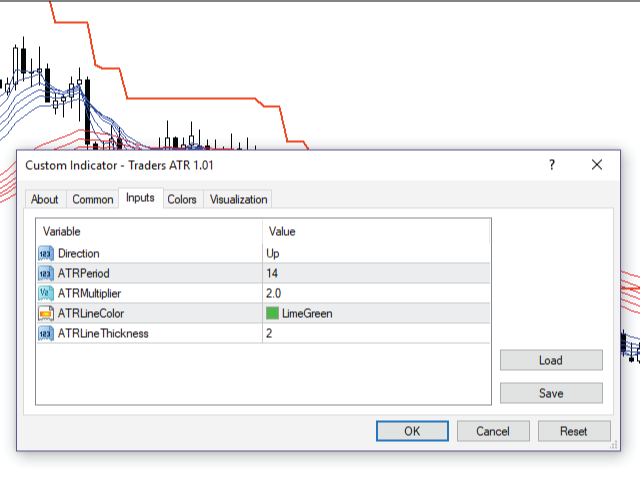
- Simply drag the indicator from your indicator list onto the chart. This will open the dialogue box where you can edit your settings.
- Press OK.
- Click on the bar you want to start the ATR from.
- The ATR will appear from the specified bar.
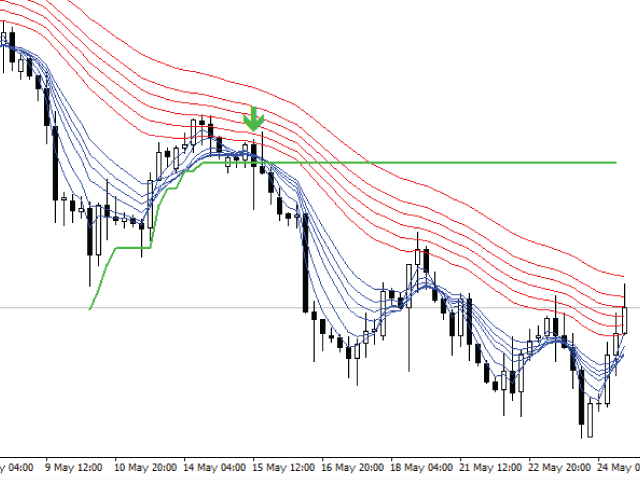
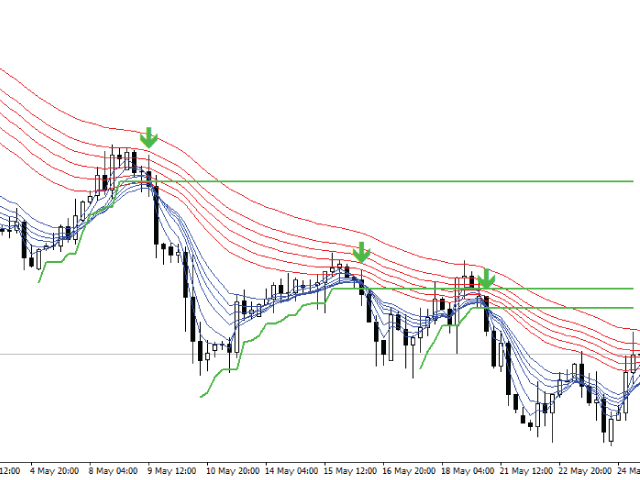
- On a long ATR when price closes below the line, an exit is triggered and an arrow will appear.
- On a short ATR when price closes above the line, an exit is triggered and an arrow will appear.
Using ATR as an Entry
Use the ATR in conjunction with your preferred trend identification indicator. If the trend is down, wait for a rally to occur. Use a Long ATR from the lowest point of the trend. When price breaks below the ATR value, this is an entry signal. If the trend is up, wait for a pull back. Use a Short ATR from the highest point of the trend. When price breaks above the ATR value this is an entry signal.
Using ATR as a Stop loss:
Once a trade has been opened, attach the corresponding ATR to the chart. If the trade is long, attach a long ATR to the most recent significant low in the trend. If trade is short, attach a short ATR to the most recent significant high in the trend. When price closes and breaks the ATR, exit the trade.
Using the GMMA
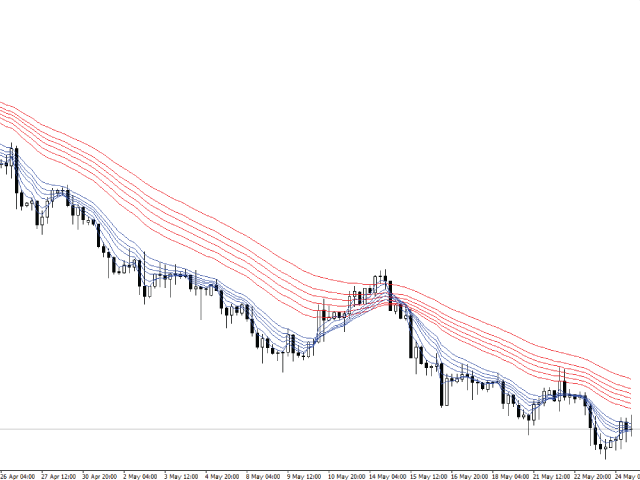
The Guppy Multiple Moving Average is based in chaos theory and brings together the relationship between long term investors (the red group) and short term traders (the blue group). When the blue group is above the red group we are in an uptrend. When the blue group is below the red group we have a downtrend. The width of each group signifies the strength for the trend. If the blue group compresses and turns down, while the red group remains well separated this indicates temporary weakness and an entry area. If there is compression in both groups we look for a trend change.
Customizable Features
- Direction: Long or Short
- ATR Period: Default of 14, any whole value.
- ATR Multiplier: Default of 2, any real value.
- ATR line Colour
- ATR line Thickness

