Today is the Day
- Indicators
- Alexander Shienkov
- Version: 5.0
- Updated: 4 February 2024
This simple information indicator shows the name of the current day and past working days, months and years.
On the concept of time and timeframe
It is common knowledge that a timeframe is a time interval considered in technical analysis of free financial markets, during which the price and other market data changes occur when the price charts are plotted.
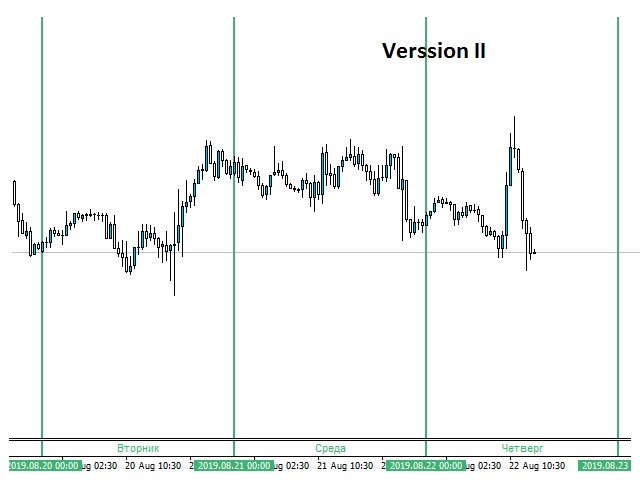
In the MetaTrader 4 trading terminal, these periods are separated by vertical dashed line, which can be enabled or disabled by simply pressing the "Ctrl + Y" key combination.
When this indicator is attached to a chart, it adds a text with the period names. This greatly facilitates the interpretation of the chart and price movements for the past and current period of time.
Indicator operation
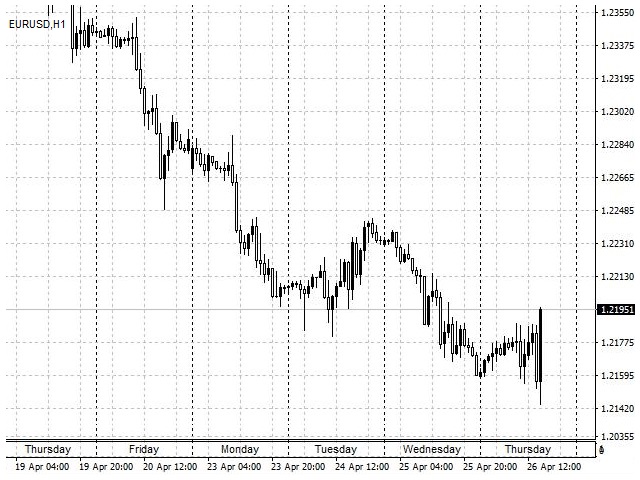
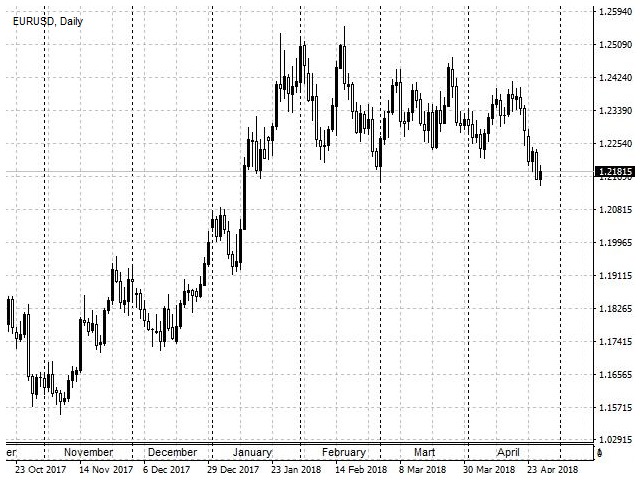
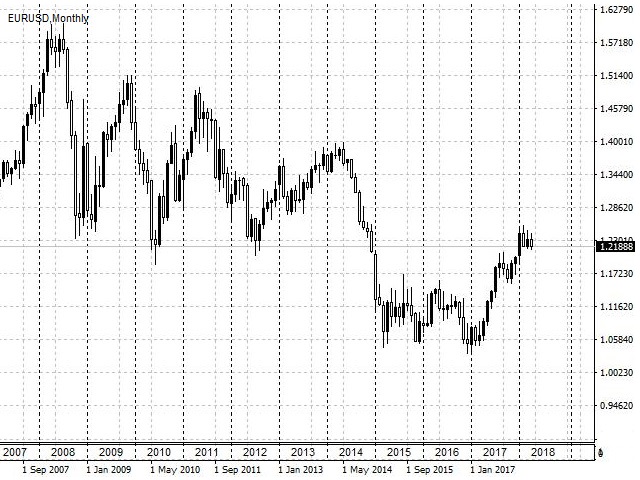
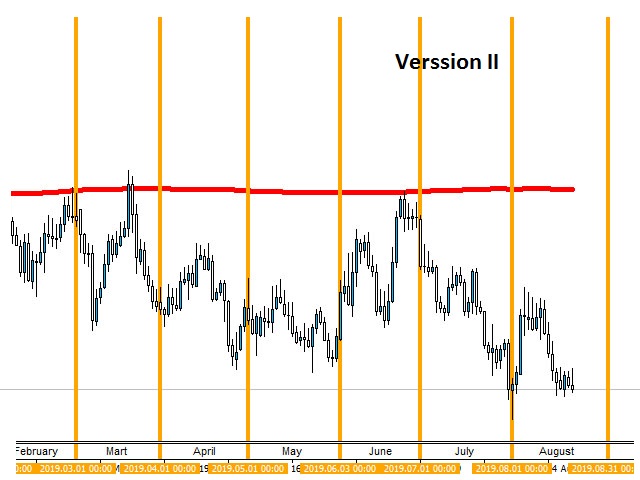
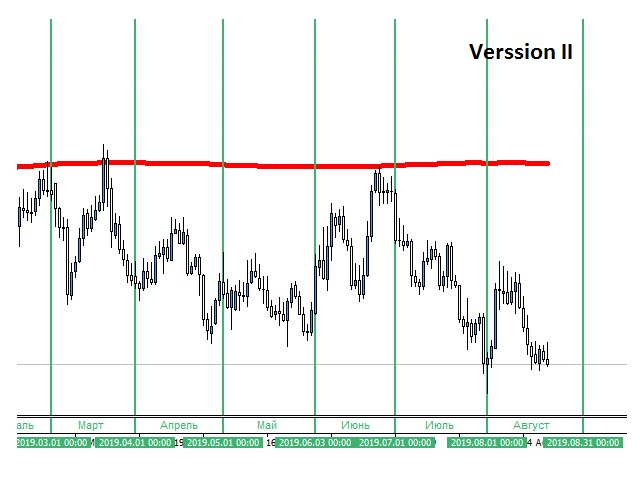
After the indicator is added to a chart with the M1 timeframe, during the day, the name of the current day of the week will appear at the bottom of the chart in the indicator's tunnel. When the chart timeframe is switched to a higher one (М5; М15; М30; Н1), the indicator will also display the names of the past days of the week and the current day. When the chart timeframe is changed to Н4 or D1, the indicator shows the names of the months. On the weekly and monthly timeframe (W1 and MN), the indicator tunnel will contain the numbers for the current and past years.
Color, size and language of the indicator text can be changed in the input parameters.
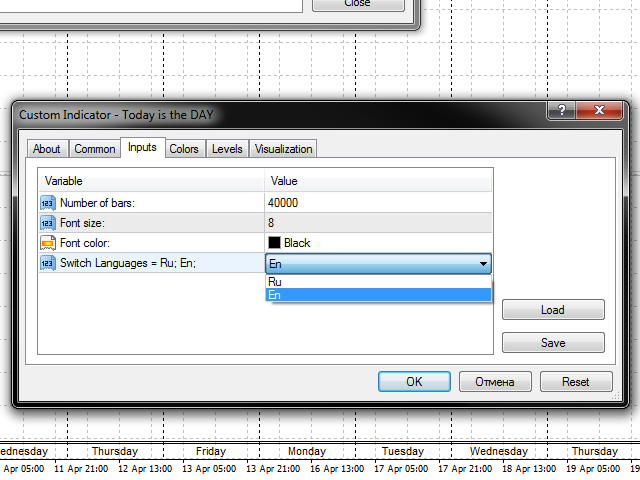
Indicator Parameters
- Number of bars – the number of bars in the chart history, default: 40000.
- Font size – text size, default: 10.
- Font color – text color, default: Black.
- Switch Languages = Ru;En; - language of the indicator text, default: En.
Note: the indicator is suitable for working with any chart background color and it is very convenient for analysis of price movements in time.

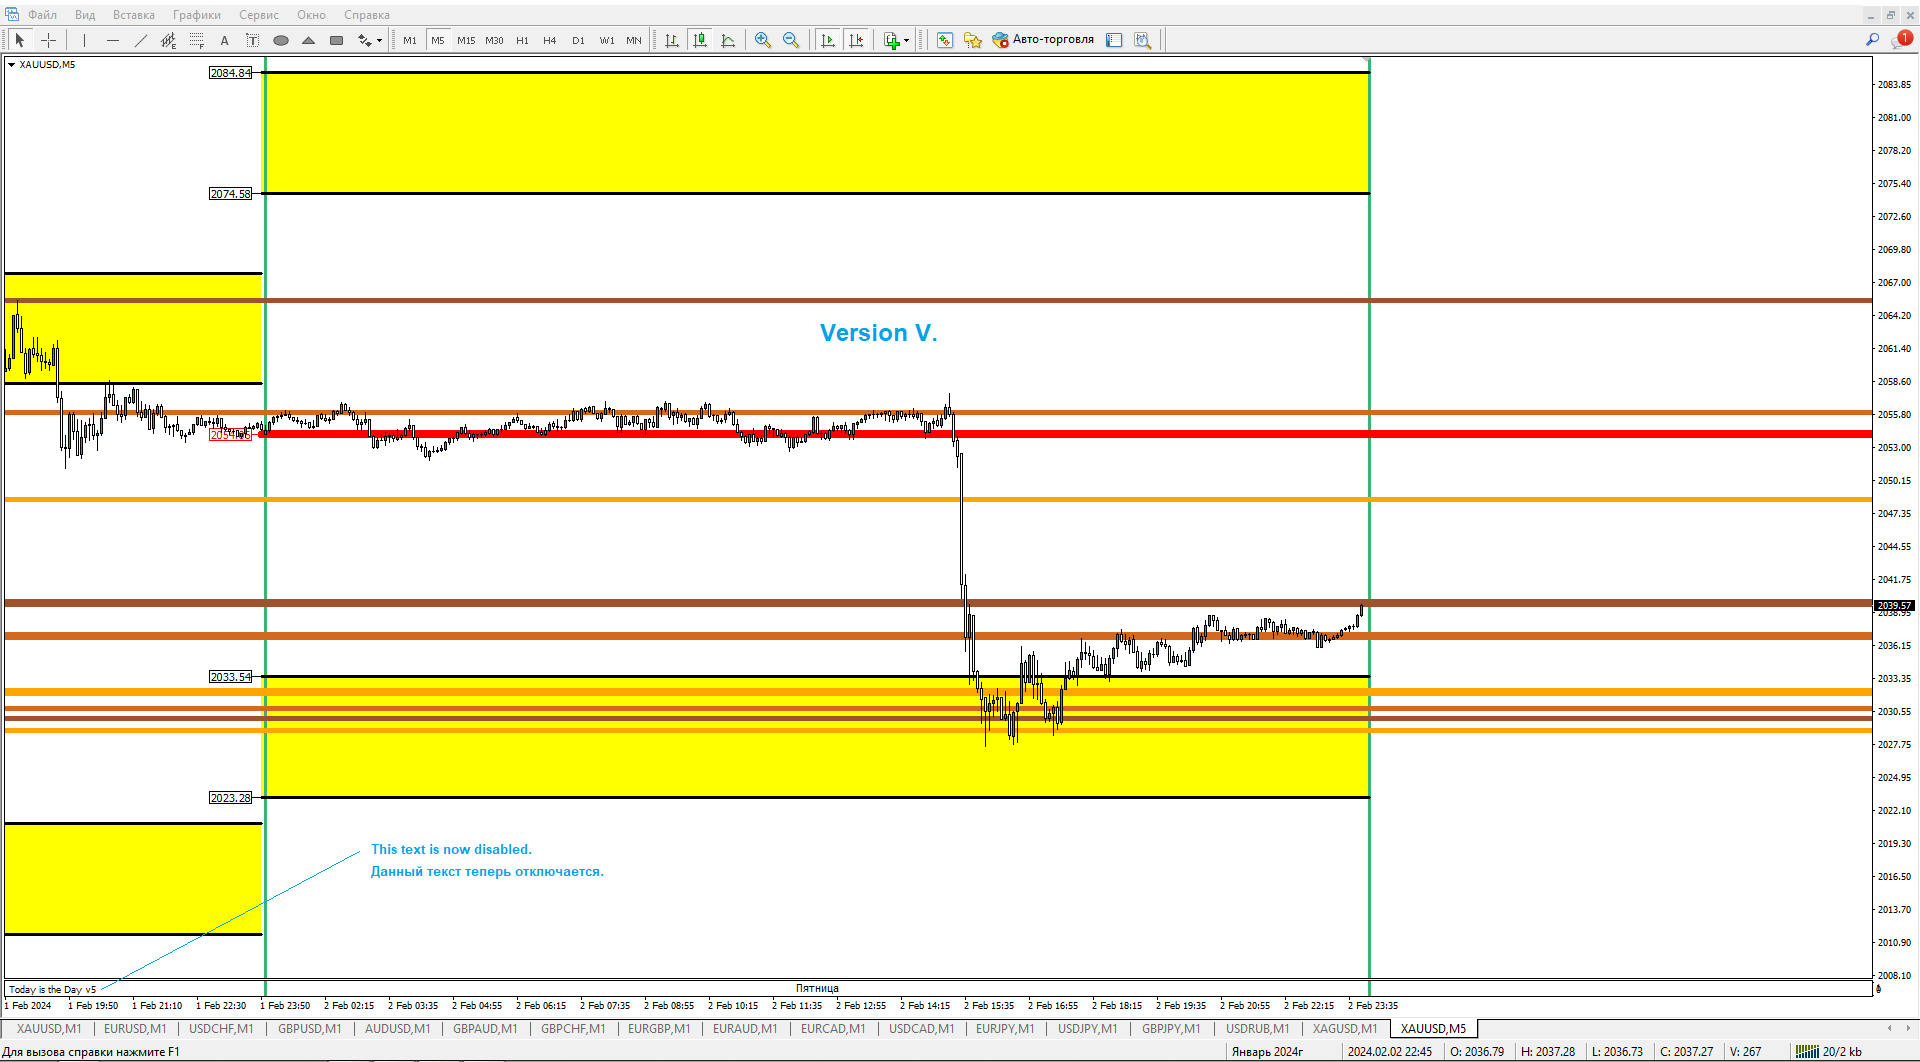


Amazing. Great indicator. Asked Alexander Shienkov, if he could improve by putting a option to show horizontal lines, and he humbly made the change. Great Guy, great indicator.