Aroon Indicator SG
- Indicators
- Stuart Goodwin
- Version: 1.0
- Activations: 5
The Aroon Indicator is a technical indicator showing whether a price is trending, the strength of the trend, and whether any reversal of trend or range-trading is likely.
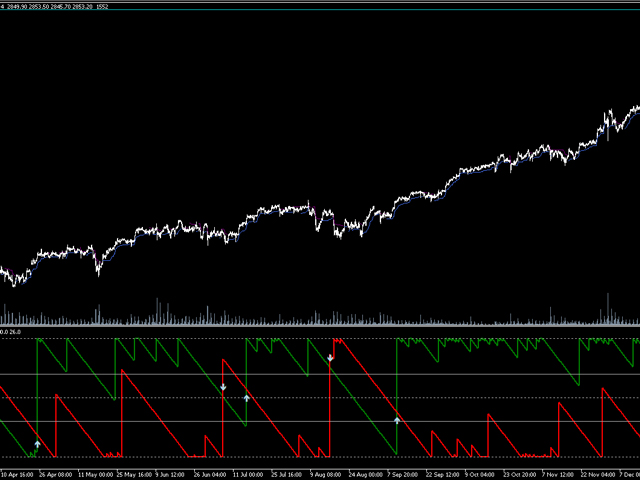
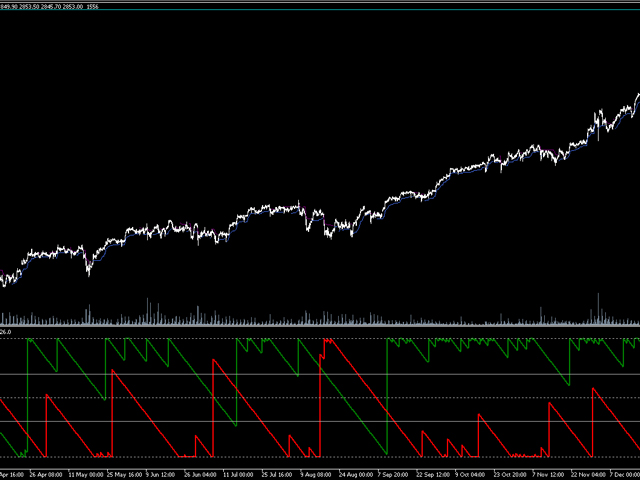
The indicator consists of two lines, the Aroon Bullish Line and the Aroon Bearish Line.
The Bullish Line is calculated as (bars in period - bars since highest high in period)/bars in period, expressed as a percentage. The bearish line is calculated similarly since the lowest low. Both are plotted on the same chart.
Thus, both lines are in a range between 0 and 100. A reading of close to 100 for a line means that the trend is strong in that direction, and a reading close to zero means the trend is weak in that direction. So for example, a strongly uptrending market will have a Bullish line close to 100 and a Bearish line close to 0, and vice versa for a downward-trending market.
The key to using the Aroon indicators successfully lies in watching two things:
- Indicator movements around the key levels, 30 and 70 - Movements above 70 indicate a strong trend, while movements below 30 indicate low trend strength. Movements between 30 and 70 indicate indecision. For example, if the bullish indicator remains above 70, while the bearish indicator remains below 30, the trend is definitively bullish.
- Crossovers between the Bullish and Bearish Indicators - Crossovers indicate confirmations if they occur between 30 and 70. For example, if the bullish indicator crosses above the bearish indicator, it confirms a bullish trend.
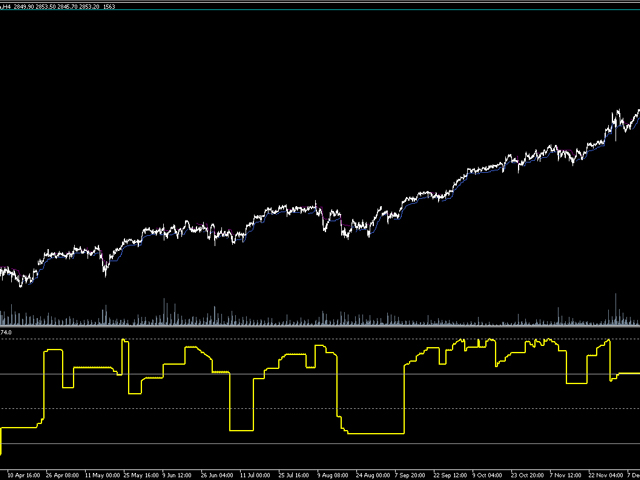
It is possible to make an oscillator from the two indicators, which is the difference between the Bullish Line and Bearish line. The Oscillator thus varies between +100 and -100.
The Oscillator is a bit simpler, but provides less information. The key levels to watch are 50, 0 and -50. When the oscillator moves above 50, it indicates a strong bullish trend. When it hovers around 0, it indicates the lack of a definitive trend. And finally, when it breaks below -50, it indicates a strong bearish trend.
Parameters
- Number of Bars Used for Calculation - length of the period used in the calculation. The higher the number, the longer the term of the trends that the indicators will be measuring. Thus, depending on the timeframe of your chart and the value for the number of bars, the indicator can measure very long-term trends right down to intra-day trends. Default is 25 bars.
- Show Indicator Crossover Arrows - when enabled, arrows will be added to the chart when a crossover of the Bullish and Bearish lines occurs, and will indicate the bullish or bearish direction of that crossover. Crossovers in the 30-70 range are most important and can indicate a change in trend. Default is set to enabled. Arrows are not shown on the Oscillator chart.
- Show Oscillator Instead of Indicators - when set to true, the Oscillator will be shown instead of the two indicators, and the arrows will not be shown. Default is set to false.


Ein guter Indikator für Trendstärke und Trendrichtung.