TrendSign
- Indicators
- Joel Protusada
- Version: 1.0
- Activations: 5
The indicator has the following features
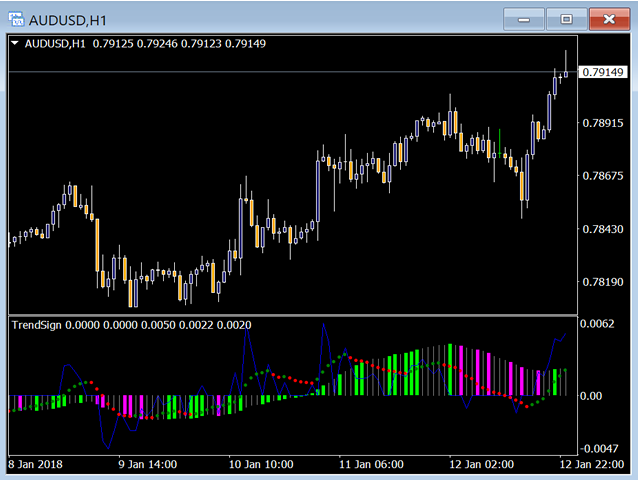
- Predictive Trend (Histogram) - it uses an advanced predictive probability and statistics calculation plus linear regression to know the possible trend. This must be used with at least 3 timeframes for a more accurate reading of the trend: D1, H4, H1. In some cases (subjective), you may want to use M5 for a more precise reading.
- Velocity (Dotted Line) - Green dotted line indicates a speed of price movement upward. Red dotted line indicates a speed of price movement downward.
- Strength (Solid Line) - Sloping upward indicates bullish strength of the price. Sloping downward indicates bearish strength of the price trend.
Parameters
- PredictiveTrendIndicator - true displays the predictive trend histogram. False displays no histogram.
- VelocityIndicator - true displays the green and red dotted line that indicates price speed.
- StrengthIndicator - true displays the solid blue line that tells the strength of the price trend.
How To Use
Attach the indicator on a chart that you want to analyze. Determine the trend, velocity and strength.
- Predictive Trend - The histogram has 3 colors: gray, lime (light green) and magenta (like pink). The gray may indicate the trend is slowing down or the trend is changing. Do not be alarmed if you see the gray color. Most of the time it is just a slowdown of the trend but not necessarily a change of trend. The most important colors that you need to see are the lime and magenta. Lime means the trend is going up. Magenta means the trend is going down. To know a real trend, starting from the rightmost bar going left, determine the most recent color that you see (excluding gray). If you see lime, the trend is bullish. If you see magenta, the trend is bearish. For real bullish trend, you have to see lime in D1, H4, H1, and M5 timeframes. For real bearish trend, you have to see magenta in D1, H4, H1, and M5 timeframes. For more successful trades, use a trailing stop lower than 50 pips. The lower the value of your trailing stop the more conservative.
- Velocity - If you see the dotted line in green dots, it indicates the speed of the bullish price. The steeper the upward direction of the green dotted line, the faster the movement of the price. If you see the dotted line in red dots, it indicates the speed of the bearish price. The steeper the downward direction of the red dotted line, the faster the movement of the price.
- Strength - The blue line indicates the strength of the bullish trend if it's above zero or steeper upward. It indicates the strength of the bearish trend if it's below zero or steeper downward.

