HMA Trend Professional MT5
- Indicators
- Pavel Zamoshnikov
- Version: 3.41
- Updated: 2 June 2021
- Activations: 10
Improved version of the free HMA Trend indicator (for MetaTrader 4) with statistical analysis.
The main differences from the free version:
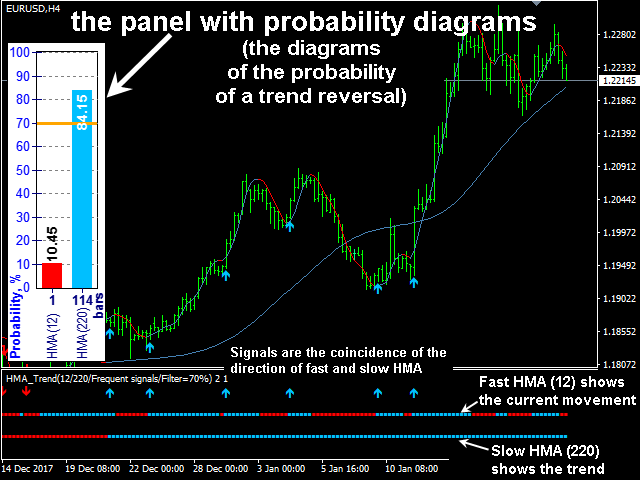
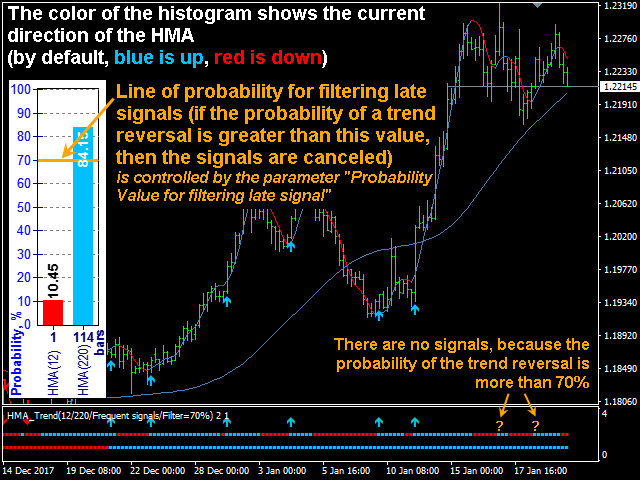
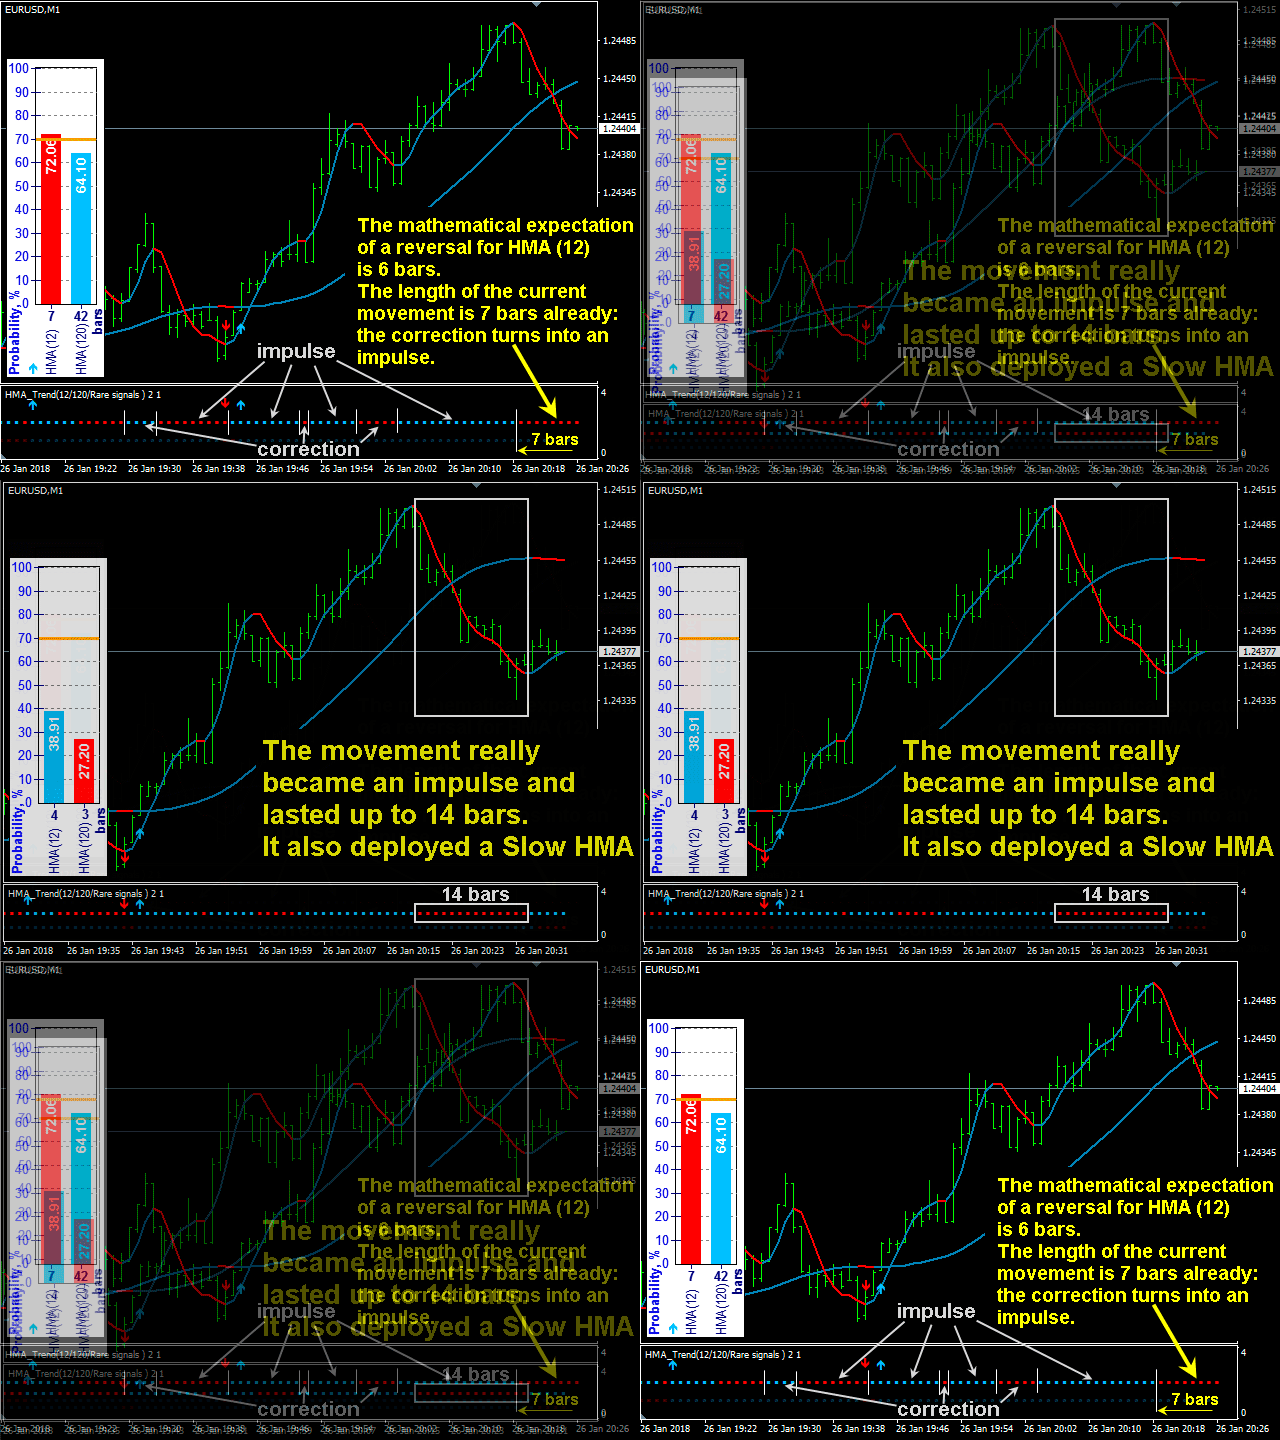
- Ability to predict the probability of a trend reversal using analysis of history data.
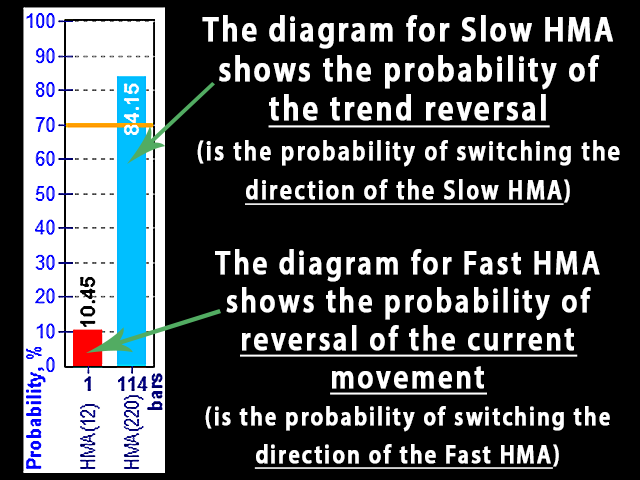
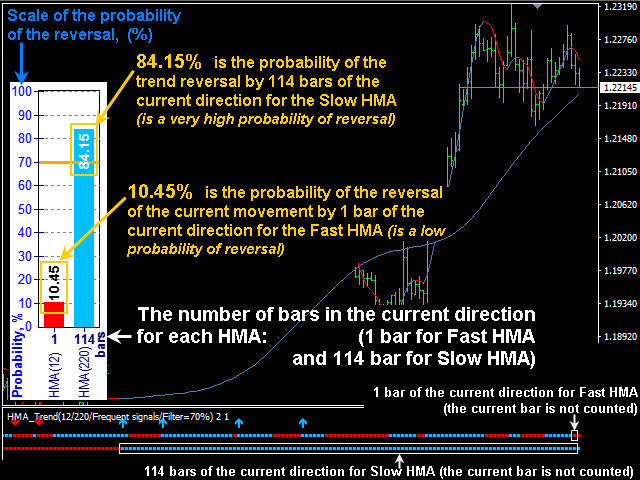
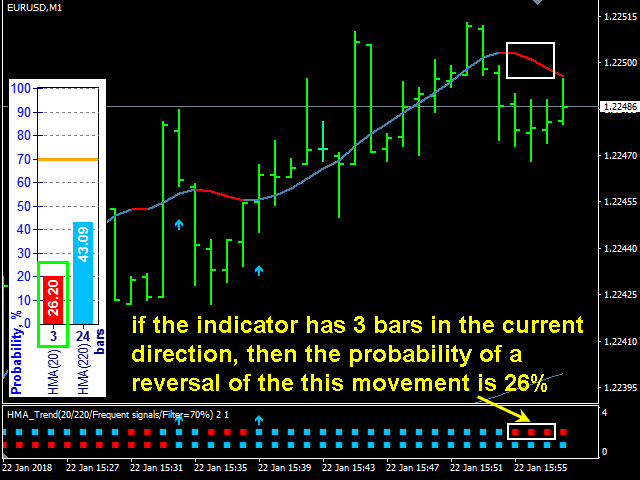
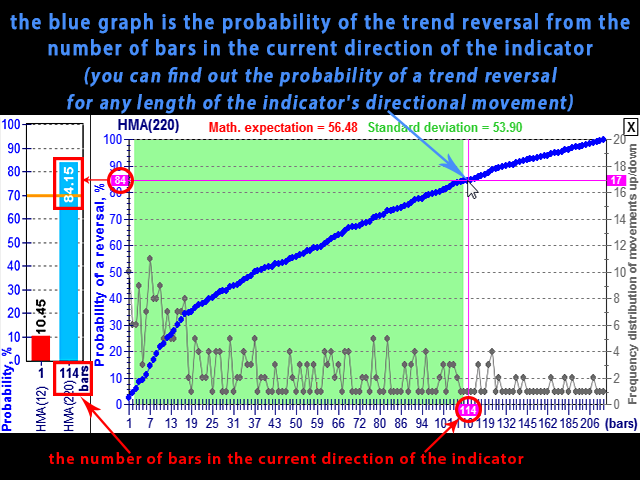
- Plotting statistical charts for analyzing the probability of a reversal.
- Automatic filtering of signals with a high probability of trend reversal.
- Ability to generate preliminary signals on the current open bar (can be canceled).
What is it and how does it work?
The HMA indicator changes color when its movement direction changes. This feature can be used to try to predict the change in the direction of the indicator, and, therefore, to predict the trend reversal. The probability of a trend reversal is the probability of switching the direction of the slow HMA
The indicator examines the behavior of the HMA indicator on the entire history, analyzes the number of switches and the duration of each direction of the indicator, estimates the probability of indicator reversal on the current bar, calculates the expected value and the standard deviation, and draws the statistical diagrams of the distribution series for subsequent analysis by the trader
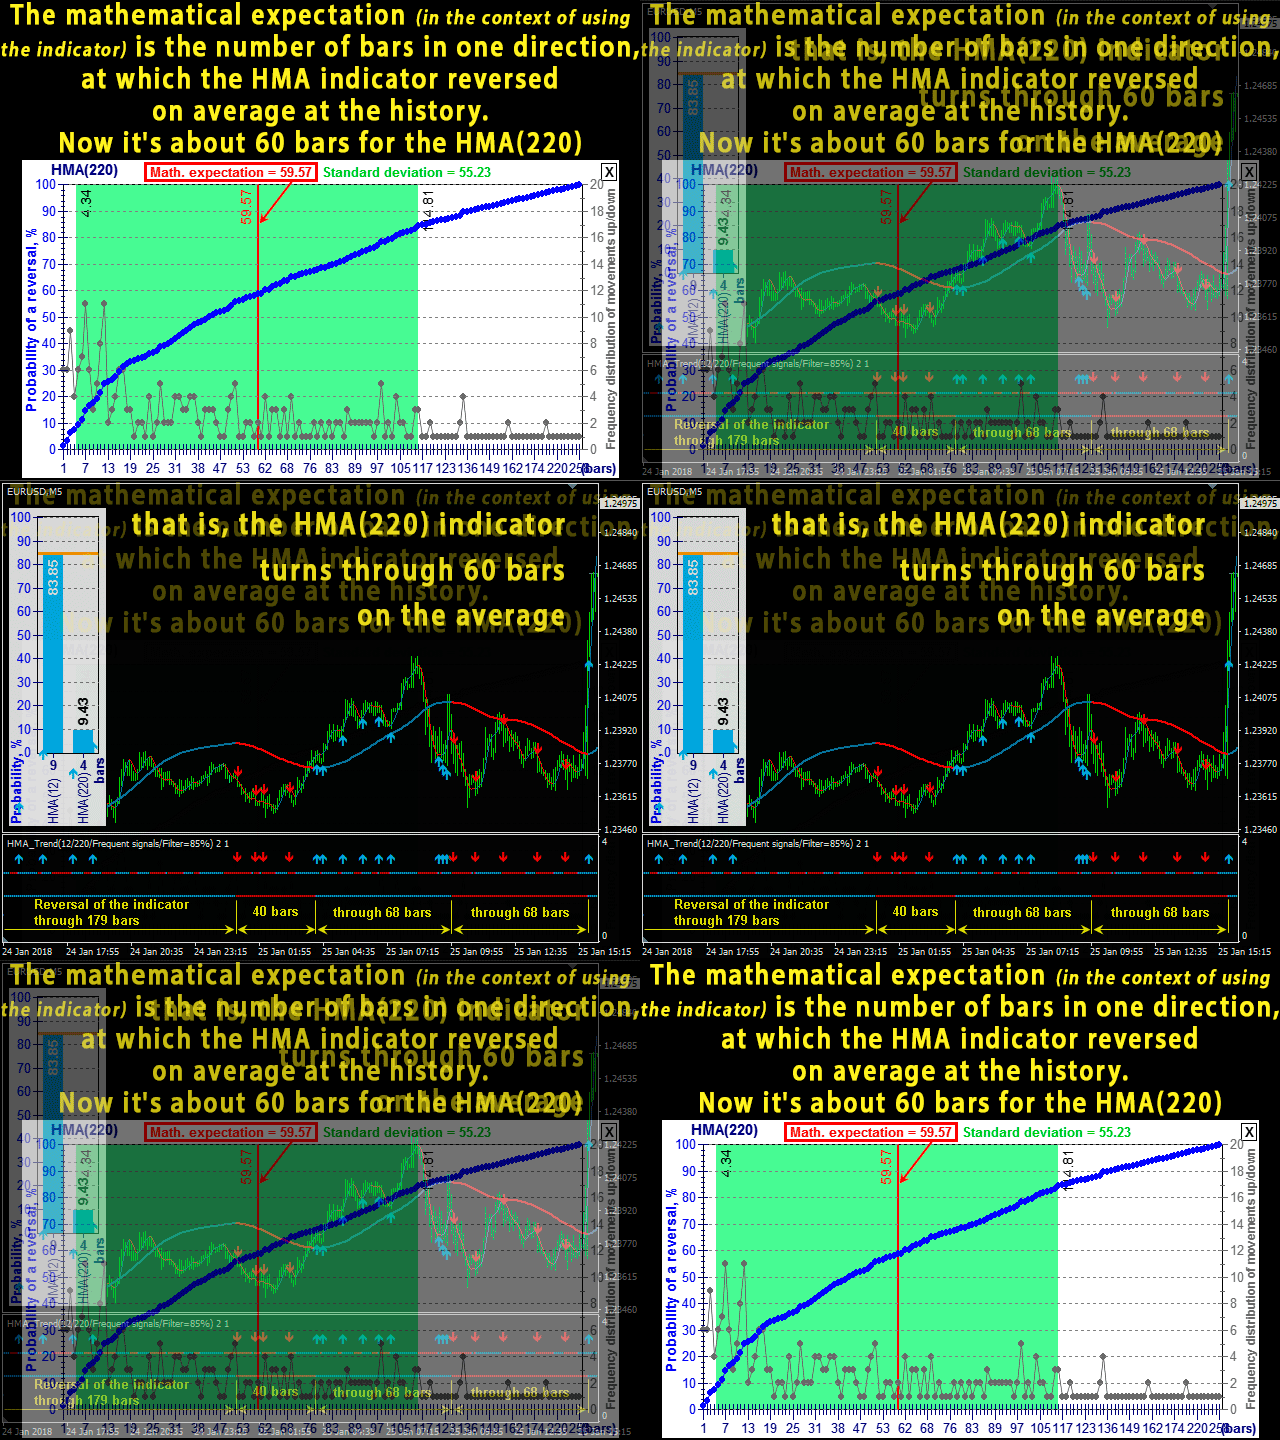
Expected value (in the context of the indicator use) is the number of the HMA indicator bars in the same direction in history, where the HMA indicator had reversed on average
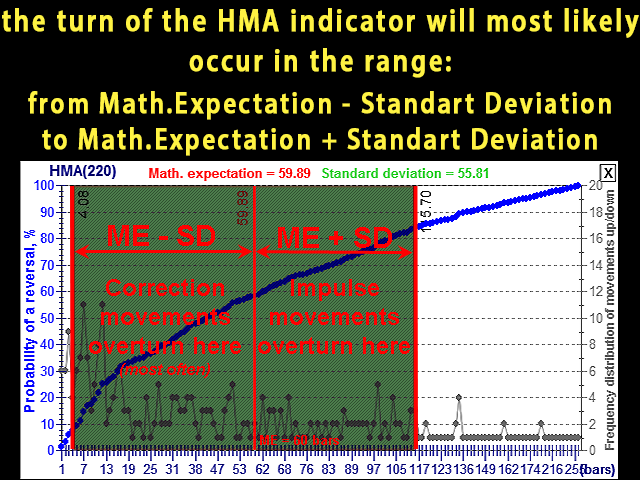
Standard deviation (in the context of the indicator use) - the HMA indicator is most likely to reverse in the range of bars from ME-SD to ME+SD (where ME is the expected value, SD is the standard deviation)
In practice, impulse movements are noted to occur most often in the range of ME+SD bars, and the retracement movements take place within the range of ME-SD bars
You can use all statistical data in your Expert Advisor through indicator buffers.
See usage example in the "Comments" tab
How is this applied?
If you know that the slow HMA is probable to change the movement direction, do not open a deal, since the old trend has already been exhausted, and the probability of reversal or correction is high
If you see a possibility of the fast HMA switching in the near future, open a deal at the end of the retracement movement and close a profitable deal at the end of the impulse movement
The video shows a record of real-time trading, demonstrating the indicator features with explanations of all the actions performed
For easy monitoring of the indicator please use the free version of the "HMA Color with Alerts MT5" indicator.
Please watch the video - there is a recording of trades in real time, demonstrating the use and capabilities of the indicator with explanations of all actions performed
Parameters
HMA settings - parameters of the Hull indicators
- Fast HMA period - fast HMA period
- Slow HMA period - slow HMA period
- HMA averaging method - smoothing method
- the Frequency of signals in the trend direction - frequency of signals in the trend direction:
- Frequent signals (by switching Fast HMA) - frequent signals by switching of the fast HMA in the direction of the slow HMA
- Rare signals (by switching Slow HMA)) - rare signals by switching of the slow HMA
- Arrows of signals in main window - draw signal arrows in the main window
- Rendering depth of signals (=0 - the whole history) - the number of bars to draw the signals (0 - all history)
- the Probability Value for filtering late signals (Freq.signals) - the probability value, above which the late signals are filtered out (only for the frequent signals)
- Position of the panel to display the probability - position of the panel with the probability diagrams:
- Left-Up
- Left-Down
- Right-Up
- Right-Down
- Color of UP-trend signal - color of the Up signal
- Color of DOWN-trend signal - color of the Down signal
Notifications/Sounds - text and sound settings







Благодарю Павел, я в восторге от твоих инструментов HMA и Gann.