Panic Meter limited
- Indicators
- Dmitriy Gurenko
- Version: 1.0
The indicator measures the frequency of incoming ticks to analyze the market activity. Bullish and bearish ticks are analyzed separately, informing about the currently predominant market sentiment. According to observations, an increase in the frequency of ticks (panic) indicates the beginning of strong price changes, and an increase in the frequency of ticks in a particular direction not only accompanies a price change in this direction, but also often anticipates it.
The indicator is indispensable for scalping.
Distinctive features
- Greater sensitivity of the indicator and a small delay. When analyzing ticks, knowing that activity had increased five minutes ago is equivalent to not knowing.
- Display as a step chart, which allows seeing the history of frequency changes.
- Display of the average frequency for the previous periods, which increase in informativeness of the chart.
- Separate display of ascending and descending tick frequencies.
Appearance and use
The chart recalculates the indication values once a second. All indicator values are expressed in 1/min.
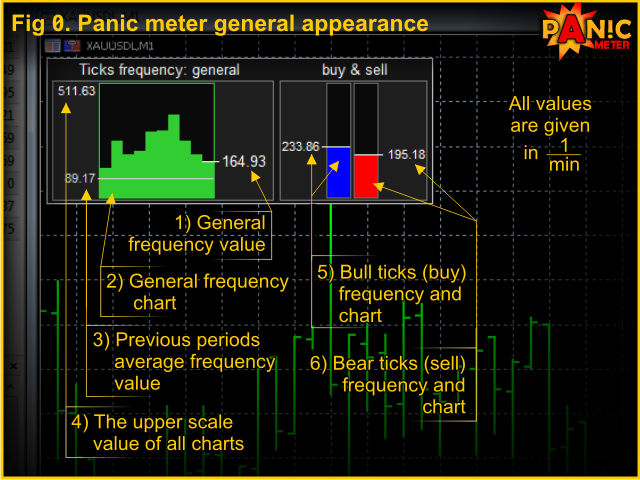
The indicator interface consists of the following elements (see Fig. 0)
- The current value of incoming ticks frequency is displayed on the right of the frequency chart.
- The main frequency chart. It visualizes the last ten values of ticks frequency. When the current frequency exceeds the average (see below), which signifies an active market, the chart border becomes green.
- The average frequency value of the current period is displayed on the left of the chart and as a gray horizontal level on the chart. It is calculated as the average frequency of ticks for the current 30 minutes over the last 10 days.
- The upper limit of the chart scale is displayed in the upper left corner. The charts of all three frequencies have the same vertical scale. Although the frequency values of bullish and bearish ticks are calculated according to a slightly different formula, this value facilitates visual orientation.
- The indicator of ascending (bullish) ticks frequency is the left (blue) chart, the numerical value is located to the left of it. The calculation formula involves not only the number of ticks and time, but also the price. Therefore, it would be more correct to call it the frequency of positive price changes in points. If there are significantly more ascending ticks than descending ones (which indicates a strong "bullish" sentiment at the moment), the border becomes blue.
- The frequency indicator for the descending (bearish) ticks is the right (red) chart. Behavior and calculation are similar to item 5.
Input parameters
The indicator does not use input parameters and does not require configuration.
Launching the indicator
Drag the indicator to the desired chart. At startup, the indicator is displayed in the upper left corner, but you can double-click it and move it to the desired location. The indicator needs to receive 15 ticks before it can be visualized (the number of ticks remaining before the start is displayed in the header).
Attention! This is the version with a limited set of available symbols: Gold (XAUUSD) and Canadian Dollar (***CAD) in any pairs. The indicator will start on all other instruments, but it will pause for 50-100 ticks every 50-100 seconds.
Attention! Due to technical limitations, the indicator can not be used in a visual tester.


Too busy to be of any practical use