Sticky SAR
- Indicators
- Dmitriy Zaytsev
- Version: 3.10
- Updated: 20 May 2022
- Activations: 5
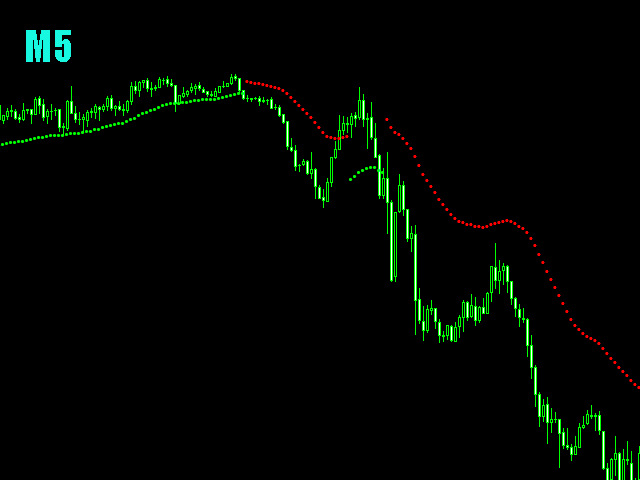
This indicator is designed for determining the trend direction and price reversal points. This indicator is a heavily modified version of Parabolic SAR.
- Does not repaint/redraw
- Calculation on an current candle
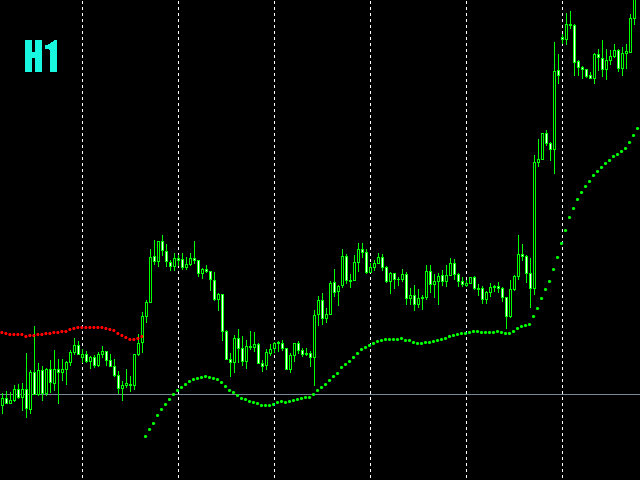
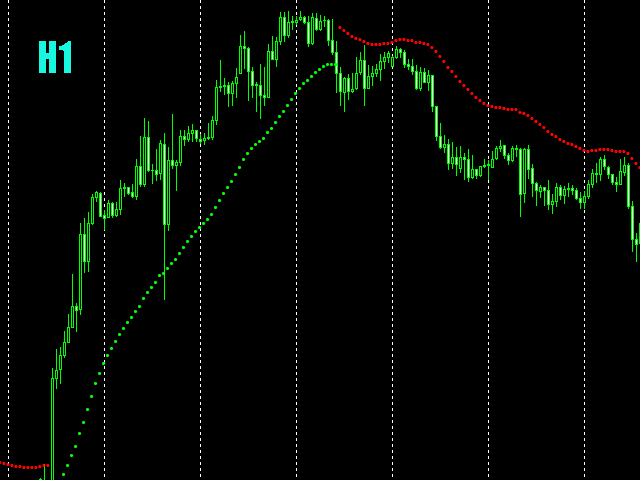
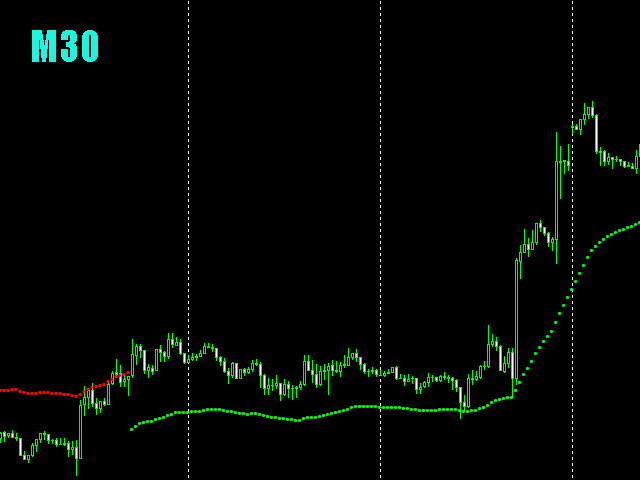
- If the price is above the indicator, trend is ascending. If the price is below the indicator, trend is descending.
Trade:
- If the color and the trend direction changed, open a position and close it by take profit, or hold it until the next trend change.
- It is also possible to trade rebounds of the price from the indicator.
- The indicator can also be used as an addition to your trading system for extra confirmation.
- The indicator works best on the smaller timeframes. Therefore, it will be useful for scalping.
Settings
- BarsHistory - the number of bars to be used to display the indicator.
- IndicSpeed - display the indicator with acceleration of the data readings.
* true - enabled, false - disabled.












User didn't leave any comment to the rating