Multi Exposition Meter
- Utilities
- Boyan Taksirov
- Version: 1.1
- Updated: 28 August 2017
- Activations: 5
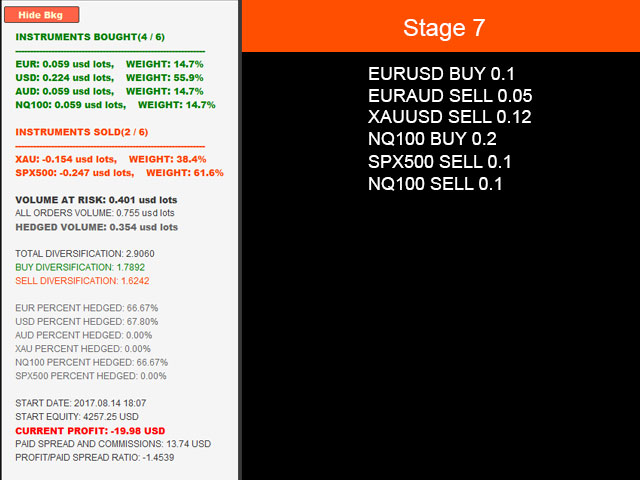
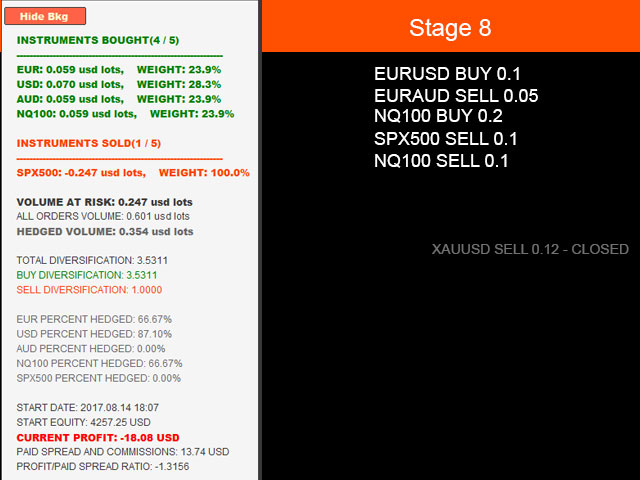
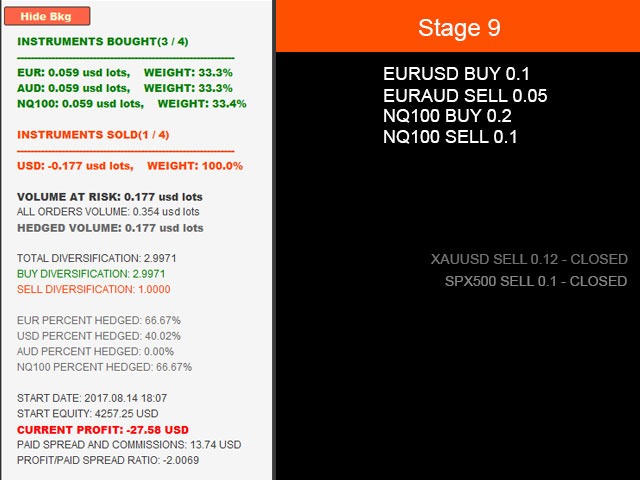
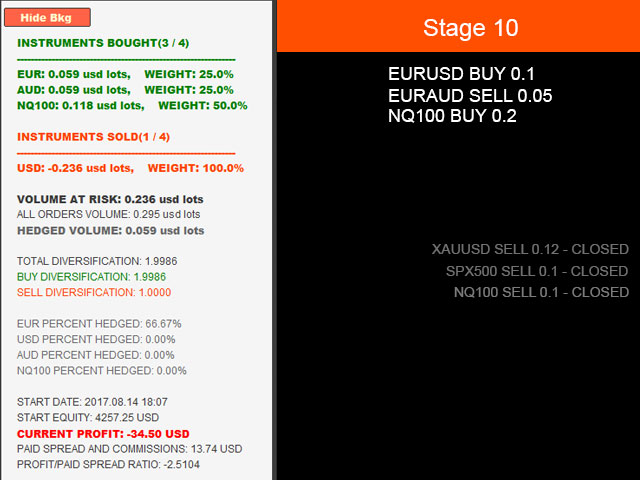
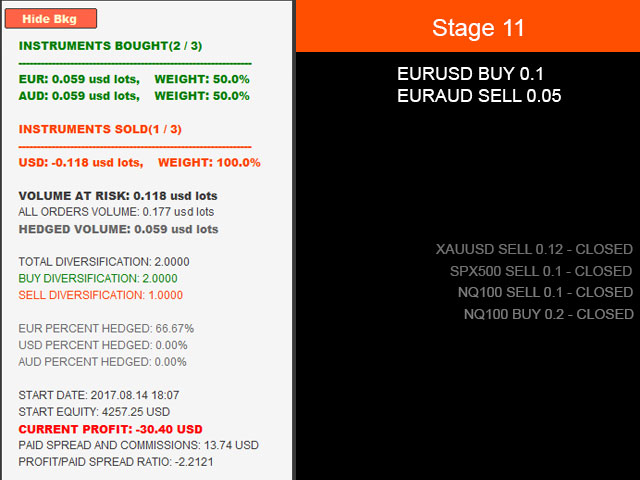
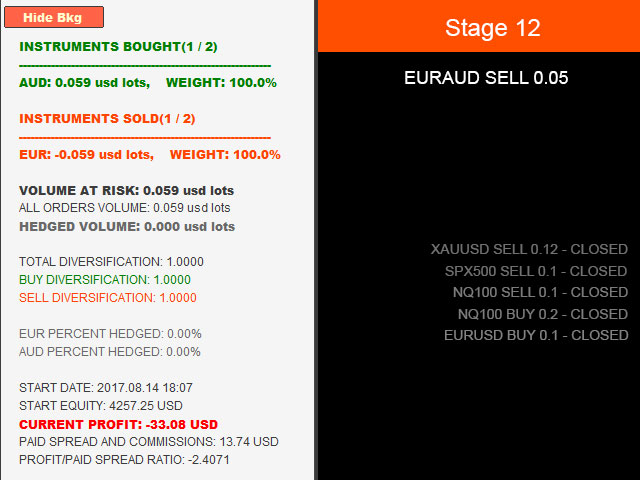
Multi Exposition Meter makes your multi instrument exposure clear and readable, no matter how complicated and hedged it is.
It does the following:
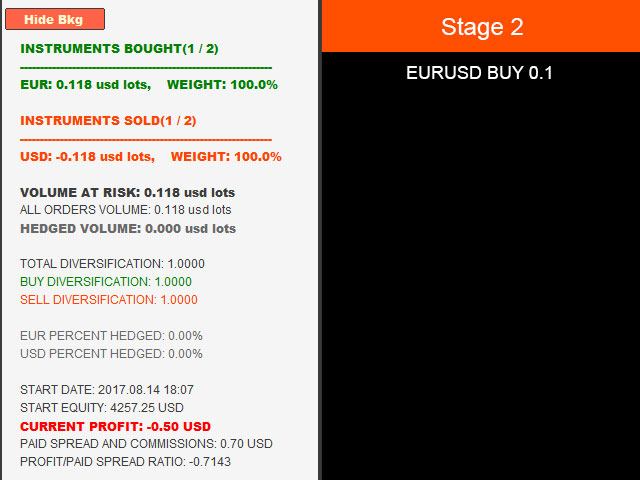
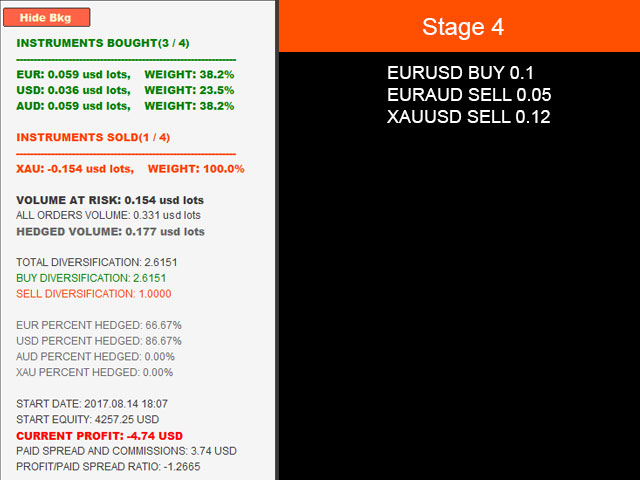
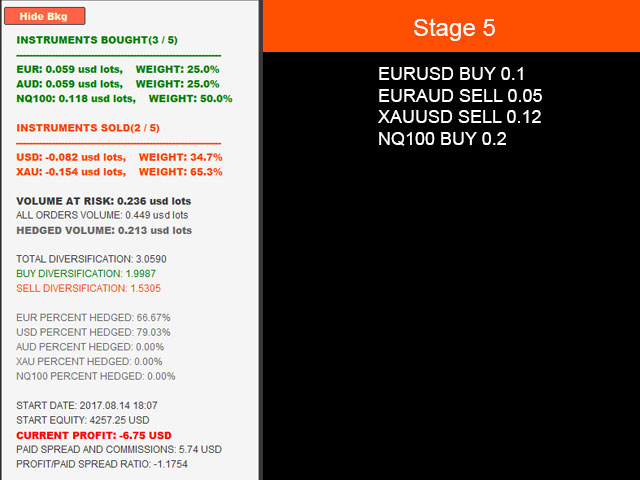
- It measures which instruments are traded against which ones in any moment.
- Measures the exposure share (weight) of each instrument, regarding its volume.
- Measures total volume, volume at risk and hedged volume.
- It measures the factor of diversification of the exposure.
- It calculates the amount of hedging per each instrument, in percent.
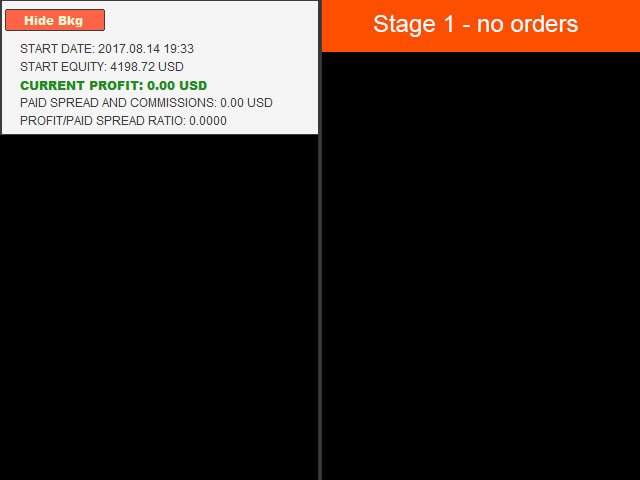
- Shows spread costs of filled orders.
- Displays profit/paid spread cost ratio from the beginning of the trading session.
If you like to diversify your risk, and probably hedge it, this product might be in use for you.
If you pay attention to the instrument strength (currency index), maybe you will like it even more.
No matter if you trade currencies, commodities, CFD's and/or indices at the same time, your exposure will be clear for reading all of the time. Which instruments are exposed against which instruments? What is the level of diversification, considering the different volumes for different instruments? What is the weight of each instrument in a given exposure? Are you overexposed without knowing it? What is the hedging level in percentage of a given instrument? What part of all the volume in the exposure is hedged?
These questions might not have a quick answer in an elaborate and dynamic markets and expositions, when often the situation changes fast. This becomes visible in a following example:
A trader has opened EURUSD BUY 0.12 position.
Later on she opens GBPUSD SELL 0.07 position. So she has EUR BUY 0.12 (EUR lots), USD SELL 0.12 (EUR lots). But USD is being bought 0.07 GBP lots against GBP, so this should be considered. 0.07*1.30 (GBP/USD rate at the moment) = 0.091 USD lots.
0.12 EUR lots = 0.12*1.1820 (EUR/USD rate at the moment) = 0.142 USD lots.
So, USD exposure is 0.142 SELL + 0.091 BUY = 0.051 SELL.
All exposure by the moment:
EUR: 0.142 (USD lots) BUY
USD: 0.051 (USD lots) SELL
GBP: 0.091 (USD lots) SELL
So, EUR is against GBP and USD right now. EUR should rise and USD and GBP should fall in order the trader to close on profit. GBP has a higher risk, so the down movement of the pound is preferable to the decline of the USD.
Let's continue. Shortly, our trader decides that FTSE100 SELL 0.2 would be a good addition to her portfolio.
FTSE100 is traded in GBP, so this affects GBP exposure... To find how exactly, she should know the price of FTSE lot in GBP (FTSE100 price*FTSE100 lot size), and then convert it to USD and multiply this value by the exact volume of the order (in this case 0.2). Then she should subtract the number from the FTSE100 exposure and add the same number to the current GBP exposure. This looks like it will hedge and reverse GBP exposure...
Then, the trader closes half of the EURUSD position, but buys DAX30 (traded in EUR) 0.11 and sells WTI (traded in USD) 0.17...
How does the exposure look right now? What instruments should rise, and what of them should fall in order the Trader to be profitable?
Or am I already annoying?
I guess there is no need to continue in order to prove how cumbersome these calculations are when there is not a plenty of time.
Fortunately, this utility does all these calculations and even more. At any moment trader can see the structure of the exposure of her orders and gauge the risk. This, combined with currency strength indicators definitely gives some edge.

