Color Stochastic with an analytical panel
- Indicators
- Oleg Kvashin
- Version: 1.20
- Activations: 5
The main advantage of this indicator is filtering of buy and sell signals in the direction of the market impulse and ranking them by strength. Configuration of the indicator is simple and intuitive. All you need to do is to react only to strong signals. Adhere to the money management rules.
Description
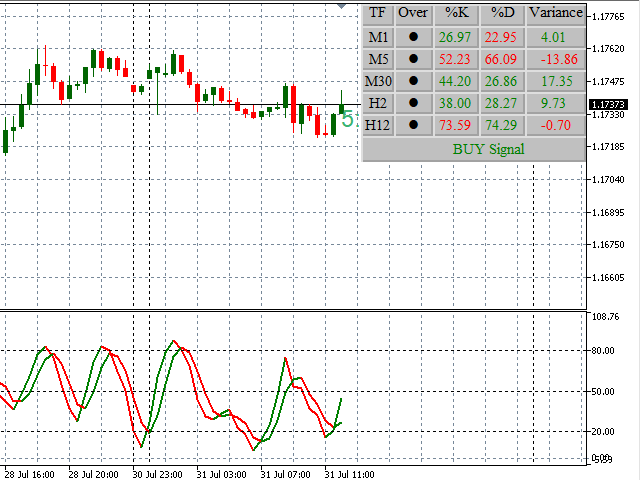
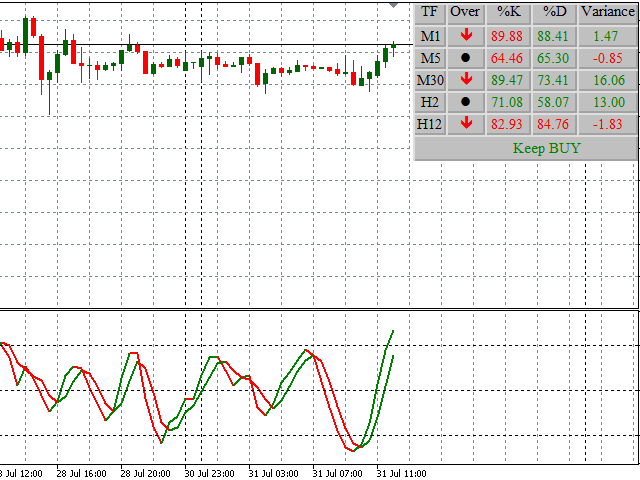
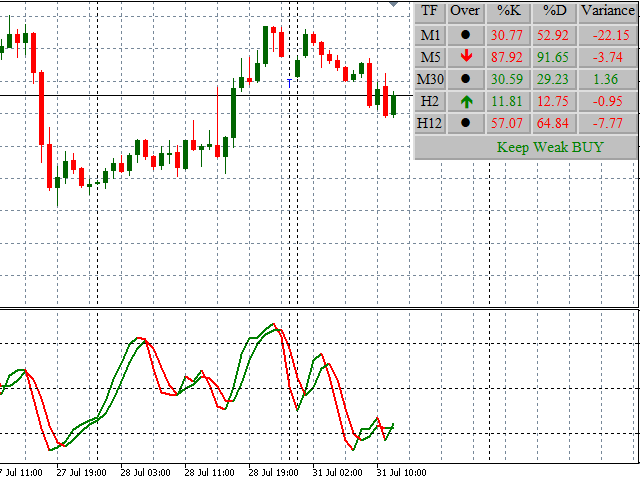
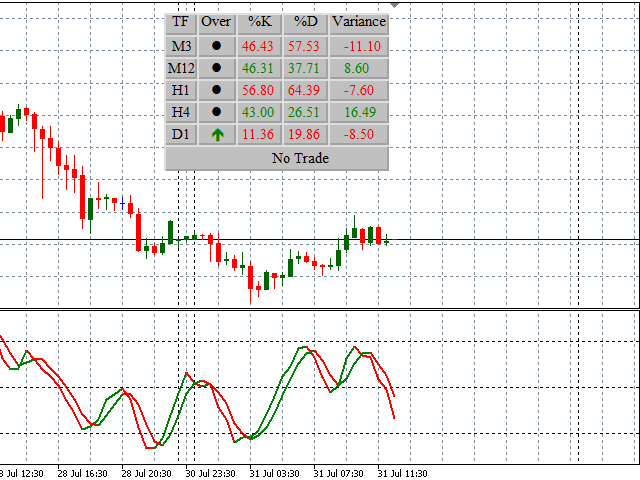
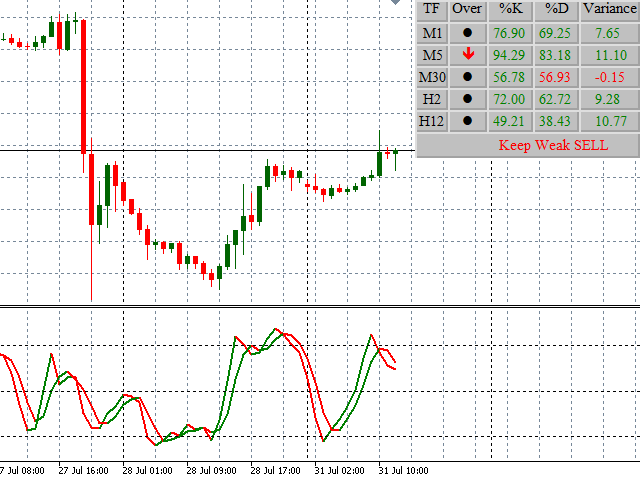
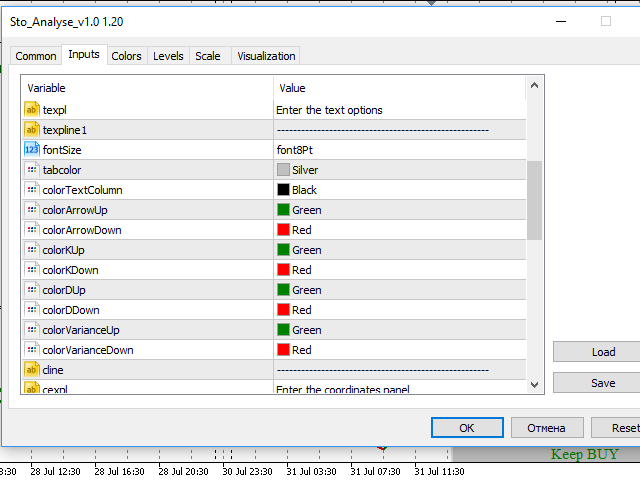
The Color Stochastic with an analytical panel indicator consists of the Stochastic indicator itself and the information/analytics panel. The indicator provides options for configuring the parameters and adjusting the colors. You can customize the color scheme, thickness and appearance of the lines. The information/analytics panel displays the values of the %K and %D lines of the Stochastic, as well as their difference for different periods. The bottom of the panel displays trading recommendations.
- No Trade - stay out of the market.
- Weak BUY/SELL Signal - weak buy/sell signal. Trading this signal is not recommended. It usually means a corrective movement.
- BUY/SELL Signal - buy/sell signal. It is recommended to open positions.
- Strong BUY/SELL Signal - strong buy/sell signal. It is highly recommended to open positions.
The Keep... recommendations indicate a continuation of the corresponding trend. Keep your position and increase profits.
The indicator allows selecting M30, H1, H4 or D1 as the working period. Thus, with this indicator you will be able to trade both with a day and during multiple days and weeks. Users can customize the color scheme of the information/analytics panel. The default settings are as follows.
- Black dot - indicator values are in the neutral zone.
- Red down arrow - Stochastic is in the overbought zone. A downward reversal is expected.
- Green up arrow - Stochastic is in the oversold zone. An upward reversal is expected.
Red and green colors mean a decrease and an increase in the indicator values relative to the previous ones.
Working with the indicator
The Color Stochastic with an analytical panel indicator provides tremendous opportunities for analyzing the market situation and making trading decisions. But even if you do not have this experience, you can work effectively using the recommendations. Below are some tips that will help you in analyzing the market situation.
- Change in the color of the Stochastic lines indicates a market reversal.
- Position of the Stochastic above/below the 50 level indicates an uptrend/downtrend.
- The sto_overbuy and sto_oversold parameters allow setting a filter, where the buy/sell signals are to be ignored.
- The signals from the working periods (M30, H1, H4, D1) should be taken only in the context of the tendencies on the higher periods. The smaller periods serve as confirmation of the signals from the working periods. For this purpose, you can use divergence, position of the indicator relative to the 20, 50, 80 levels, the development of the Stochastic rise/fall during a certain period.
- The more values of the same color are present in the Variance column, the stronger the signal and the stronger the market impulse.
- The more periods are in the overbought/oversold areas, the more probable is the previous movement to end and change.
- A change in the trend on the smaller periods indicates that the tendency on the higher periods will change soon.
It should be noted that the Color Stochastic with an analytical panel indicator alone is not sufficient for a successful trading. Make sure you use trend indicators and support/resistance levels in your trading.







Great product, A perfect solution to traders who believe in price Action. It is an intelligent interplay of price movement. This is a must have trading tool. Quite resourceful for professionals and newbies