• Overview
  • Reviews (20)
  • Comments (50)
  • What's new

Multi oscillator divergence

4.67

I recommend you to read the product's blog (manual) from start to end so that it is clear from the beginning what the indicactor offers.

This indicator for Metatrader 4 identifies when a divergence occurs between price and an oscillator/indicator. It identifies both bullish and bearish divergences. It has a RSI filter option which makes it possible to filter out only the strongest setups. The indicator also offers options to wait for an Engulfing formation, Donchian channel breakout or for price to cross a moving average (see screenshot #3) to confirm the divergence before signaling the trade opportunity. Combined with your own rules and techniques, this indicator will allow you to create (or enhance) your own powerful system.

Features

  • At the end of the blog you will be able to download the source code of an example Expert Advisor (EA) which is using the iCustom() function to retrieve trade signals from the indicator. Even though the EA is fully functional, the main purpose is to use the code and paste it into your own developed EA. Given my limited time I will not be able to provide with any programming support though. My apologies.
  • Can detect divergences for the following oscillators/indicators: MACD (Metatrader native), OsMA, Stochastics, RSI, CCI, RVI, Awesome, ADX, Composite index, ATR, OBV, MFI, Momentum, Accumulation/Distribution and Accelerator. Only one oscillator/indicator can be selected.
  • Draws solid lines for regular/classical (potential reversal) divergences and dashed lines for hidden (trend continuation) divergences. The lines are drawn on the chart as well as in the indicator window.
  • Sends an alert when a divergence or a breakout/cross has been detected. All Metatrader native alert types are supported.

Input parameters

Please find the description and explanation of the input parameters here.

Reviews 20
Tran Cong Minh Duc
242
Tran Cong Minh Duc 2021.10.13 06:20 
 

Good signal when trader can combine with OB and OS in big TF.

kamz1419
149
kamz1419 2021.07.08 13:55 
 

Great product, does exactly what’s required and provides timely alerts and a range of oscillator indicators to choose from. Jan provides excellent support and is very quick to reply. Thanks

Resti Prima
228
Resti Prima 2021.03.25 16:15 
 

i already buy this product today and still test, so far so good, im scalping trade, entry on m1 or m5 with sett indicator on m15 and m30. my result is good (for a while) now i want to test the Free EA related with this indi. i will back and give more star after test. Jan is good person, and fast response, i like it. Thanks Jan!! :)

Recommended products
Chart Patterns Detect 15 patterns (Ascending Triangle, Descending Triangle, Rising Wedge, Falling Wedge, Bullish Flag, Bearish Flag, Bullish Rectangle, Bearish Rectangle Symmetrical triangle, Head and Shoulders, Inverted Head and Shoulders, Triple top, Triple Bottom, Double Top, Double Bottom) Use historical data to calculate the probability of each pattern to succeed (possibility to filter notification according to the chance of success) gives graphic indication about the invalidation level and
Alpha Trend sign has been a very popular trading tool in our company for a long time. It can verify our trading system and clearly indicate trading signals, and the signals will not drift. Main functions: Based on the market display of active areas, indicators can be used to intuitively determine whether the current market trend belongs to a trend market or a volatile market. And enter the market according to the indicator arrows, with green arrows indicating buy and red arrows indicating se
Binary Options Support Resistance Indicator This indicator is designed for binary options trading and effectively shows retracements from support and resistance levels. Signals appear on the current candle. A red arrow pointing downwards indicates a potential selling opportunity, while a blue arrow pointing upwards suggests buying opportunities. All that needs adjustment is the color of the signal arrows. It is recommended to use it on the M1-M5 timeframes as signals are frequent on these timef
PZ Divergence Trading
PZ TRADING SLU
5 (2)
Unlock hidden profits: accurate divergence trading for all markets Special Offer: Purchase now to receive free bonuses worth $90! (Read more for details) Tricky to find and scarce in frequency, divergences are one of the most reliable trading scenarios. This indicator finds and scans for regular and hidden divergences automatically using your favourite oscillator. [ Installation Guide | Update Guide | Troubleshooting | FAQ | All Products ] Easy to trade Finds regular and hidden divergences Su
Introduction to X3 Chart Pattern Scanner X3 Cherart Pattern Scanner is the non-repainting and non-lagging indicator detecting X3 chart patterns including Harmonic pattern, Elliott Wave pattern, X3 patterns, and Japanese Candlestick patterns. Historical patterns match with signal patterns. Hence, you can readily develop the solid trading strategy in your chart. More importantly, this superb pattern scanner can detect the optimal pattern of its kind. In addition, you can switch on and off individu
PZ ABCD Retracement
PZ TRADING SLU
4 (5)
Identify precise entry and exit points with AB=CD patterns This indicator finds AB=CD retracement patterns. The AB=CD Retracement pattern is a 4-point price structure where the initial price segment is partially retraced and followed by an equidistant move from the completion of the pullback, and is the basic foundation for all harmonic patterns. [ Installation Guide | Update Guide | Troubleshooting | FAQ | All Products ] Customizable pattern sizes Customizable AC and BD ratios Customizable br
Gartley Projection D
Oleksandr Medviediev
3.71 (7)
The indicator identifies the harmonic patterns (XABCD) according to developments of H.M.Gartley ( "Profits in the Stock Market" , 1935г). It projects D-point as a point in the perspective projection (specify ProjectionD_Mode = true in the settings). Does not redraw. When a bar of the working timeframe closes, if the identified pattern point has not moved during Patterns_Fractal_Bars bars, an arrow appears on the chart (in the direction of the expected price movement). From this moment on, the ar
This indicator works on MT4 and is very easy to use. When you receive a signal from it, you wait for that candle with the signal to close and you enter your trade at the beginning of the next new candle . A red arrow means sell and a green arrow means buy. All arrows comes with Alert  like for easy identification of trade signal. Are you okay with that? 1 minute candle 1 minute expire
[ZhiBiCCI] indicators are suitable for all cycle use, and are also suitable for all market varieties. [ZhiBiCCI] Green solid line is a reversal of bullish divergence. The green dotted line is a classic bullish divergence. [ZhiBiCCI] The solid line to the red is a reverse bearish divergence. The red dotted line is a classical bearish divergence. [ZhiBiCCI] can be set in the parameters (Alert, Send mail, Send notification), set to (true) to send instant signals to the alarm window, email, insta
Trend Catcher with Alert
Issam Kassas
4.73 (59)
The Trend Catcher: The Trend Catcher Strategy with Alert Indicator is a versatile technical analysis tool that aids traders in identifying market trends and potential entry and exit points. It features a dynamic Trend Catcher Strategy , adapting to market conditions for a clear visual representation of trend direction. Traders can customize parameters to align with their preferences and risk tolerance. The indicator assists in trend identification, signals potential reversals, serves as a trail
FREE
Trend PA
Mikhail Nazarenko
5 (3)
The Trend PA indicator uses   Price Action   and its own filtering algorithm to determine the trend. This approach helps to accurately determine entry points and the current trend on any timeframe. The indicator uses its own algorithm for analyzing price changes and Price Action. Which gives you the advantage of recognizing, without delay, a new nascent trend with fewer false positives. Trend filtering conditions can be selected in the settings individually for your trading style. The indicator
The Penta-O is a 6-point retracement harmonacci pattern which usually precedes big market movements. Penta-O patterns can expand and repaint quite a bit. To make things easier this indicator implements a twist: it waits for a donchian breakout in the right direction before signaling the trade. The end result is an otherwise repainting indicator with a very reliable trading signal. The donchian breakout period is entered as an input. [ Installation Guide | Update Guide | Troubleshooting | FAQ | A
The indicator detects and displays Shark harmonic pattern (see the screenshot). The pattern is plotted by the extreme values of the ZigZag indicator (included in the resources, no need to install). After detecting the pattern, the indicator notifies of that by a pop-up window, a mobile notification and an email. The indicator highlights the process of the pattern formation and not just the complete pattern. In the former case, it is displayed in the contour triangles. After the pattern is comple
VR Cub
Vladimir Pastushak
VR Cub is an indicator for getting high-quality entry points. The indicator was developed to facilitate mathematical calculations and simplify the search for entry points into a position. The trading strategy for which the indicator was written has been proving its effectiveness for many years. The simplicity of the trading strategy is its great advantage, which allows even novice traders to successfully trade with it. VR Cub calculates position opening points and Take Profit and Stop Loss targe
Atomic Analyst
Issam Kassas
5 (2)
First of all Its worth emphasizing here that this Trading Indicator is   Non-Repainting , Non Redrawing and Non Lagging Indicator   Indicator, Which makes it ideal from both manual and robot trading.  User manual: settings, inputs and strategy . The Atomic Analyst  is a PA Price Action Indicator that uses Strength and Momentum of the price to find a better edge in the market. Equipped with Advanced filters which help remove noises and false signals, and Increase Trading Potential. Using Multiple
BSA Indicator
Ahmet Metin Yilmaz
BSA indicator is a ZigZag based indicator. This indicator is used to find the reversal level of the price. You can use the existing risk ratio and calculation timeframe in the entries by optimizing them according to your usage preference.  In lower time frames, the indicator can repaint. For healthier results, you can detect the least repainting by observing for a while according to the graphic you will apply.
Fibonacci retracement and extension line drawing tool Fibonacci retracement and extended line drawing tool for MT4 platform is suitable for traders who use  golden section trading Advantages: There is no extra line, no too long line, and it is easy to observe and find trading opportunities Trial version: https://www.mql5.com/zh/market/product/35884 Main functions: 1. Multiple groups of Fibonacci turns can be drawn directly, and the relationship between important turning points can be seen
Crypto_Forex Indicator  " 3 Black Crows pattern" for MT4. Indicator "3 Black Crows pattern" is very powerful for Price Action trading:   No repaint, No delay. Indicator   detects bearish "3 Black Crows" patterns on chart:  Red arrow signal on chart (see pictures). With P C, Mobile & Email alerts. Also its brother -   bullish   "3   White Soldiers   pattern"   indicator is available (follow the link below). Indicator  "3   Black Crows   pattern"   is excellent to   combine with Support/Resistan
The CCI Divergence is a reasonably useful indicator in itself, but it is even more effective when used with divergence pattern trading. The CCI Divergence indicator signal is one of the most potent signals among the indicators that exist in the market. Here is new version for Divergence Indicator using CCI method, with more improvements. Divergences indicate a potential investment point because the directional moment does not confirm the price. A bullish divergence occurs when the underlying va
Automated Trendlines
Georgios Kalomoiropoulos
5 (16)
Trendlines  are the most essential tool of technical analysis in forex trading.  Unfortunately, most  traders don’t draw them correctly. Automated Trendlines indicator is a professional tool for serious traders that help you visualize the trending movement of the markets . There are two types of Trendlines Bullish Trendlines and Bearish Trendlines. In the uptrend, Forex trend line is drawn through the lowest swing-points of the price move. Connecting at least two "lowest lows" will create a tr
Title : UT_Bot - ATR-Based Trading Indicator Introduction : Discover the power of "UT_Bot," the ultimate trading indicator that leverages the Average True Range (ATR) to provide unparalleled accuracy in your trading decisions. If you're seeking a more reliable alternative to the Super Trend indicator, look no further. UT_Bot is your key to precision trading. Key Features : ATR-Powered Precision: UT_Bot uses the ATR to deliver accurate signals that adapt to market volatility. Enhanced Trend Detec
Wave Trend MT4
Diego Arribas Lopez
MT5 Version   Wave Trend MT4 Wave Trend is an oscillator, which helps identifing in a extremely accurate manner market reversals. The Oscillator being obove the overbought level and a cross down of the fast into the slow MA usually indicates a good SELL signal. If the oscillators is below the oversold level and the fast MA crosses over the slower MA usually highlights a good BUY signal. The Wave Trend indicator can be also used when divergences appear against the price, indicating the current mo
Advanced Stochastic Scalper
Evgeny Belyaev
4.53 (15)
Advanced Stochastic Scalper - is a professional indicator based on the popular Stochastic Oscillator. Advanced Stochastic Scalper is an oscillator with dynamic overbought and oversold levels, while in the standard Stochastic Oscillator, these levels are static and do not change. This allows Advanced Stochastic Scalper to adapt to the ever-changing market. When a buy or a sell signal appears, an arrow is drawn on the chart and an alert is triggered allowing you to open a position in a timely mann
Atrade
Victor Golovkov
Full automatic. Does not require technical settings. Works on all currency pairs. The indicator has a built-in zigzag filter that limits repetitions of unidirectional signals (i.e. after a buy signal, the next one will be a sell signal, and vice versa). For the convenience of displaying, the indicator provides settings for the type of icons, their color and size: Size Arrow Code Arrow Buy Color Arrow Buy Code Arrow Sell Color Arrow Sell Indicator signals are not redrawn.
Advanced Trend Regime
Shellard Securities (Pty) Ltd
The indicator has been designed to function on any time-frame and any pair.   This regime filter will help the trader better evaluate whether the current market is trending, and in which direction. It quickly reacts to changes in market dynamics using a series of advanced calculations. The user is able to select whether the calculation remains standard, or if a further filter constraint is added to the calculation.   A Yellow moving average of the signal has been included for the trader to smoot
**FxCycle WaveSignal Indicator** The **FxCycle WaveSignal Indicator** is the perfect solution for traders who want to identify strong and accurate trading opportunities using a **wave pattern** approach combined with **Exponential Moving Averages (EMA)**. This indicator is designed to provide clear **Buy** and **Sell** signals based on price movement around the **Upper** and **Lower Wave Line**, as well as presenting an attractive visual display directly on your charts. #### **Main Features:*
The indicator places Semaphore points on the maximum and minimum of a higher, medium and lower period. It includes A,B,C Triangles for easier spotting of reversal chart pattern which occurs very frequently and has a very high success ratio. Both Semaphore and A,B,C Triangles have Alerts and Push notifications to a mobile device when they occur on the chart. These indicators are very useful for breakout trading and spotting support/resistance levels which gives good opportunities for positions.
Gioteen Volatility Index (GVI)   - your ultimate solution to overcoming market unpredictability and maximizing trading opportunities. This revolutionary indicator helps you in lowering your losing trades due to choppy market movements. The GVI is designed to measure market volatility, providing you with valuable insights to identify the most favorable trading prospects. Its intuitive interface consists of a dynamic red line representing the volatility index, accompanied by blue line that indicat
ExactArrows
Pavel Krysanov
3.71 (7)
The main aim of this indicator lies in determining entry and exit points, that is why the ExactArrow indicator does not draw nothing but arrows which show entry and exit points. In spite of apparent simplicity of the indicator, it has complicated analytic algorithms which determine entry and exit points. The indicator generates exact and timely entry and exit signals which appear on the current candle. The indicator generates an average of 1-2 candles before its analogues do. The indicator is ve
"Adjustable Fractals" - is an advanced version of fractal indicator, very useful trading tool! As we know   Standard fractals mt4 indicator does not have settings at all   - this is very inconvenient for traders. Adjustable Fractals has resolved that issue - it has all necessary settings: Adjustable period   of indicator (recommended values - above 7). Adjustable distance   from Highs/Lows of price. Adjustable design   af fractal arrows. // More great Expert Advisors and Indicators are availabl
Buyers of this product also purchase
Gann Made Easy
Oleg Rodin
4.82 (105)
Gann Made Easy is a professional and easy to use Forex trading system which is based on the best principles of trading using the theory of W.D. Gann. The indicator provides accurate BUY and SELL signals including Stop Loss and Take Profit levels. You can trade even on the go using PUSH notifications. PLEASE CONTACT ME AFTER PURCHASE TO GET MY TRADING TIPS PLUS A GREAT BONUS! Probably you already heard about the Gann trading methods before. Usually the Gann theory is a very complex thing not only
FX Power MT4 NG
Daniel Stein
5 (17)
FX Power: Analyze Currency Strength for Smarter Trading Decisions Overview FX Power is your go-to tool for understanding the real strength of currencies and Gold in any market condition. By identifying strong currencies to buy and weak ones to sell, FX Power simplifies trading decisions and uncovers high-probability opportunities. Whether you’re looking to follow trends or anticipate reversals using extreme delta values, this tool adapts seamlessly to your trading style. Don’t just trade—trade
FX Volume
Daniel Stein
4.59 (34)
FX Volume: Experience Genuine Market Sentiment from a Broker’s Perspective Quick Overview Looking to elevate your trading approach? FX Volume provides real-time insights into how retail traders and brokers are positioned—long before delayed reports like the COT. Whether you’re aiming for consistent gains or simply want a deeper edge in the markets, FX Volume helps you spot major imbalances, confirm breakouts, and refine your risk management. Get started now and see how genuine volume data can
Scalper Inside PRO
Alexey Minkov
4.75 (59)
!SPECIAL SALE!  An exclusive indicator that utilizes an innovative algorithm to swiftly and accurately determine the market trend. The indicator automatically calculates opening, closing, and profit levels, providing detailed trading statistics. With these features, you can choose the most appropriate trading instrument for the current market conditions. Additionally, you can easily integrate your own arrow indicators into Scalper Inside Pro to quickly evaluate their statistics and profitability
CURRENTLY 26% OFF Best Solution for any Newbie or Expert Trader! This Indicator is a unique, high quality and affordable trading tool because we have incorporated a number of proprietary features and a new formula. With only ONE chart you can read Currency Strength for 28 Forex pairs! Imagine how your trading will improve because you are able to pinpoint the exact trigger point of a new trend or scalping opportunity? User manual: click here That's the first one, the original! Don't buy a worthle
Scalper Vault
Oleg Rodin
5 (27)
Scalper Vault is a professional scalping system which provides you with everything you need for successful scalping. This indicator is a complete trading system which can be used by forex and binary options traders. The recommended time frame is M5. The system provides you with accurate arrow signals in the direction of the trend. It also provides you with top and bottom signals and Gann market levels. The indicator provides all types of alerts including PUSH notifications. PLEASE CONTACT ME AFT
Dynamic Forex28 Navigator
Bernhard Schweigert
5 (4)
Specials Discount now. The Next Generation Forex Trading Tool. Dynamic Forex28 Navigator is the evolution of our long-time, popular indicators, combining the power of three into one: Advanced Currency Strength28 Indicator (695 reviews) + Advanced Currency IMPULSE with ALERT (520 reviews) + CS28 Combo Signals (recent Bonus) Details about the indicator  https://www.mql5.com/en/blogs/post/758844 What Does The Next-Generation Strength Indicator Offer? Everything you loved about the originals, now
Golden Trend Indicator
Noha Mohamed Fathy Younes Badr
4.9 (10)
Golden Trend indicator  is The best indicator for predicting trend movement this indicator never lags and never repaints and never back paints    and give  arrow buy and sell    before the candle appear  and it will help you and  will make your trading decisions clearer its work on all currencies and  gold and crypto and all time frame This unique  indicator uses very secret algorithms to catch the  trends, so you can trade using this indicator and see the trend clear on charts  manual guide and
TrendMaestro
Stefano Frisetti
5 (3)
note: this indicator is for METATRADER4, if you want the version for METATRADER5 this is the link:  https://www.mql5.com/it/market/product/108106 TRENDMAESTRO ver 2.4 TRENDMAESTRO recognizes a new TREND in the bud, he never makes mistakes. The certainty of identifying a new TREND is priceless. DESCRIPTION TRENDMAESTRO identifies a new TREND in the bud, this indicator examines the volatility, volumes and momentum to identify the moment in which there is an explosion of one or more of these data a
FX Levels MT4
Daniel Stein
5 (2)
FX Levels: Exceptionally Accurate Support & Resistance for All Markets Quick Overview Looking for a reliable way to pinpoint support and resistance levels across any market—currencies, indices, stocks, or commodities? FX Levels merges our traditional “Lighthouse” method with a forward-thinking dynamic approach, offering near-universal accuracy. By drawing from real-world broker experience and automated daily plus real-time updates, FX Levels helps you identify reversal points, set profit targe
TPSproTREND PrO
Roman Podpora
4.79 (19)
TPSpro TRENDPRO  - is a trend indicator that automatically analyzes the market and provides information about the trend and each of its changes, as well as giving signals for entering trades without redrawing! The indicator uses each candle, analyzing them separately. referring to different impulses - up or down impulse. Exact entry points into transactions for currencies, crypto, metals, stocks, indices!  ИНСТРУКЦИЯ RUS         INSTRUCTIONS  ENG              R ecommended to use with an indicato
TPSpro RFI Levels
Roman Podpora
4.83 (23)
A key element in trading is zones or levels from which decisions to buy or sell a trading instrument are made. Despite attempts by major players to conceal their presence in the market, they inevitably leave traces. Our task was to learn how to identify these traces and interpret them correctly. ИНСТРУКЦИЯ RUS         INSTRUCTIONS  ENG            R ecommended to use with an indicator   -   TPSpro  TREND PRO -  Version MT5 Main functions: Displaying active zones for sellers and buyers! The indica
CONTACT US  after purchase to get a FREE Trading Manual & an Exclusive Trading Tips PDF! Try Now—Limited 50% Discount for First 100 Buyers! Download the  Metatrader 5 Version William Delbert Gann (W.D. Gann) was an exceptional market analyst, whose trading technique was based on a complex blend of mathematics, geometry, astrology, and ancient mathematics which proved to be extremely accurate. A Note from the Developer to all the Traders: Over 15+ years of my journey with WD Gann (William Delb
PTS Precision Index Oscillator V2
PrecisionTradingSystems
5 (1)
The Precision Index Oscillator (Pi-Osc) by Roger Medcalf of Precision Trading Systems First of all, if you have any questions please contact me via my website which you can find by searching the above title. Version 2 has been carefully recoded to be super fast to load up on your chart and some other technical improvements have been incorporated to enhance experience. Pi-Osc was created to provide accurate trade timing signals designed to find extreme   exhaustion points, the points that markets
Easy Breakout
Mohamed Hassan
5 (9)
After your purchase, feel free to contact me for more details on how to receive a bonus indicator called VFI, which pairs perfectly with Easy Breakout for enhanced confluence!   Easy Breakout is a powerful price action trading system built on one of the most popular and widely trusted strategies among traders: the Breakout strategy ! This indicator delivers crystal-clear Buy and Sell signals based on breakouts from key support and resistance zones. Unlike typical breakout indicators, it levera
Supply and Demand Dashboard PRO
Bernhard Schweigert
4.8 (20)
Currently 20% OFF ! This dashboard is a very powerful piece of software working on multiple symbols and up to 9 timeframes. It is based on our main indicator (Best reviews:   Advanced Supply Demand ). The dashboard gives a great overview. It shows: Filtered Supply and Demand values including zone strength rating, Pips distances to/and within zones, It highlights nested zones, It gives 4 kind of alerts for the chosen symbols in all (9) time-frames. It is highly configurable for your personal n
Bull versus Bear
Mohamed Hassan
4.47 (17)
Enjoy a   50% OFF   Christmas holiday sale!   Send us a message after your purchase to receive more information on how to get your  BONUS  for FREE  that works in great combination with Bull vs Bear ! Bull versus Bear is an easy-to-use Forex indicator that gives traders clear and accurate signals based on clear trend retests . Forget about lagging indicators or staring at charts for hours because  Bull vs Bear provides real-time entries with no lag and no repaint, so you can trade with confide
Currency Strength Exotics
Bernhard Schweigert
4.87 (31)
CURRENTLY 20% OFF ! Best Solution for any Newbie or Expert Trader! This Indicator is specialized to show currency strength for any symbols like Exotic Pairs Commodities, Indexes or Futures. Is first of its kind, any symbol can be added to the 9th line to show true currency strength of Gold, Silver, Oil, DAX, US30, MXN, TRY, CNH etc. This is a unique, high quality and affordable trading tool because we have incorporated a number of proprietary features and a new formula. Imagine how your trading
Reversal Master
Alexey Minkov
4.92 (13)
!SPECIAL SALE! The Reversal Master is an indicator for determining the current direction of price movement and reversal points. The indicator will be useful for those who want to see the current market situation better. The indicator can be used as an add-on for ready-made trading systems, or as an independent tool, or to develop your own trading systems. The Reversal Master indicator, to determine the reversal points,  analyzes a lot of conditions since the combined analysis gives a more accura
CURRENTLY 31% OFF !! Best Solution for any Newbie or Expert Trader! This indicator is a unique, high quality and affordable trading tool because we have incorporated a number of proprietary features and a secret formula. With only ONE chart it gives Alerts for all 28 currency pairs. Imagine how your trading will improve because you are able to pinpoint the exact trigger point of a new trend or scalping opportunity! Built on new underlying algorithms it makes it even easier to identify and confir
Matrix Arrow Indicator MT4
Juvenille Emperor Limited
5 (3)
Matrix Arrow Indicator MT4  is a unique 10 in 1 trend following 100% non-repainting  multi-timeframe indicator that can be used on all symbols/instruments: forex, commodities, cryptocurrencies, indices, stocks.  Matrix Arrow Indicator MT4 will determine the current trend at its early stages, gathering information and data from up to 10 standard indicators, which are: Average Directional Movement Index (ADX) Commodity Channel Index (CCI) Classic Heiken Ashi candles Moving Average Moving Avera
Gold Venamax MT4
Sergei Linskii
5 (1)
Gold Venamax - this is a best stock technical indicator. The indicator algorithm analyzes the price movement of an asset and reflects volatility and potential entry zones.   Indicator features: This is a super indicator with Magic and two Blocks of trend arrows for comfortable and profitable trading. Red Button for switching blocks is displayed on the chart. Magic is set in the indicator settings, so that you can install the indicator on two charts displaying different Blocks. Gold Venamax can b
Volume by Price MT4
Brian Collard
4.64 (11)
The Volume by Price Indicator for MetaTrader 4 features Volume Profile and Market Profile TPO (Time Price Opportunity). Volume and TPO histogram bar and line charts. Volume Footprint charts. TPO letter and block marker collapsed and split structure charts. Static, dynamic and flexible range segmentation and compositing methods with relative and absolute visualizations. Session hours filtering and segment concatenation with Market Watch and custom user specifications. Graphical layering, positio
Currency Strength Matrix
Raymond Gilmour
4.5 (26)
THE ONLY CURRENCY STRENGTH INDICATOR THAT IS BASED ON PRICE ACTION. DESIGNED FOR TREND, MOMENTUM & REVERSAL TRADERS This indicator  reads price action to confirm trend and strength . Advanced multi-currency and multi-time frame indicator that shows you simply by looking at one chart, every currency pair that is trending and the strongest and weakest currencies driving those trends. For full details on how to use this indicator, and also how to get a FREE chart tool, please see user manual HERE
All in One Trade
Alexey Minkov
4.48 (27)
!SPECIAL SALE!  The All-in-One Trade Indicator (AOTI) determines daily targets for EURUSD, EURJPY, GBPUSD, USDCHF, EURGBP, EURCAD, EURAUD, AUDJPY, GBPAUD, GBPCAD, GBPCHF, GBPJPY, AUDUSD, and USDJPY. All other modules work with any trading instruments. The indicator includes various features, such as Double Channel trend direction, Price channel, MA Bands, Fibo levels, Climax Bar detection, and others. The AOTI indicator is based on several trading strategies, and created to simplify market analy
Chart Patterns All in One
Davit Beridze
4.65 (17)
Try "Chart Patterns All in One" Demo and get Bonus. Send me message after trying demo to get Bonus. Leave a Comment after purchase to get 8 high quality indicators as Bonus. The Chart Patterns All-in-One indicator helps traders visualize various chart patterns commonly used in technical analysis. It supports identifying potential market behaviors, but profitability is not guaranteed. Testing in demo mode is recommended before purchasing. Current Offer : 50% discount on the "Chart Patterns All
PZ Wolfe Waves
PZ TRADING SLU
1 (1)
Precision trading: leverage wolfe waves for accurate signals Special Offer: Purchase now to receive free bonuses worth $109! (Read more for details) Wolfe Waves are naturally occurring trading patterns present in all financial markets and represent a fight towards an equilibrium price. These patterns can develop over short and long-term time frames and are one of the most reliable predictive reversal patterns in existence, normally preceding strong and long price movements. [ Installation Guide
Advanced Supply Demand
Bernhard Schweigert
4.91 (294)
CURRENTLY 26% OFF !! Best Solution for any Newbie or Expert Trader! This indicator is a unique, high quality and affordable trading tool because we have incorporated a number of proprietary features and a new formula. With this update, you will be able to show double timeframe zones. You will not only be able to show a higher TF but to show both, the chart TF, PLUS the higher TF: SHOWING NESTED ZONES. All Supply Demand traders will love it. :) Important Information Revealed Maximize the potentia
GOLD Impulse with Alert
Bernhard Schweigert
4.6 (10)
This indicator is a super combination of our 2 products  Advanced Currency IMPULSE with ALERT  and  Currency Strength Exotics . It works for all time frames and shows graphically impulse of strength or weakness for the 8 main currencies plus one Symbol! This Indicator is specialized to show currency strength acceleration for any symbols like Gold, Exotic Pairs, Commodities, Indexes or Futures. Is first of its kind, any symbol can be added to the 9th line to show  true currency strength accelerat
TradeMo is a 100% accurate signal indicator that responds only to price action.  So when the 8 linear moving average cross over the 10 linear moving average expect a buy signal and  when the 8 linear moving average cross under the 10 linear moving average expect sell signal.  That's it!   Watch me explain how I use it  here . The indicator adjust to all timeframes but I recommend using a higher timeframe like the 1 hour timeframe to maximize your pips.  I have an unique way of explaining why hig
More from author
The indicator identifies when a divergence occurs between price and an indicator or oscillator. It identifies both regular and hidden divergences. Combined with your own rules and techniques, this indicator will allow you to create (or enhance) your own powerful system. Features Can detect divergences for the following oscillators/indicators:   MACD, OsMA, Stochastics, RSI, CCI, RVI, Awesome, ADX, ATR, OBV, Composite index, MFI and Momentum. Only one oscillator/indicator can be selected. Draws
FREE
This indicator draws supply and demand zones on the chart. Combined with your own rules and techniques, this indicator will allow you to create (or enhance) your own powerful system. Please also check out the paid version which offers much more. My recommendation is to look for trading opportunities where the first zone test occurs after at least 25 bars. Features The zones have 3 colors (adjustable by input). Dark color for untested zone, medium for tested zone and light for broken zone . The p
FREE
I recommend you to read the   product's blog  (manual) from start to end so that   it is clear from the beginning what the indicator offers. The indicator identifies when a divergence occurs between price and an oscillator/indicator. It identifies both regular and hidden divergences. It has a RSI, Bollinger Bands and ATR filter options which makes it possible to filter out only the strongest setups. The indicator also offers options to wait for an Engulfing formation, Donchian channel breakout,
Please if possible consider the  paid version  which I will continue to develop (there will be no future updates for this free version). This Expert Advisor identifies when a divergence occurs between price and an oscillator/indicator. It identifies both regular/classical (trend reversal) and hidden (trend continuation) divergences. It has RSI, bollinger, stochastics, moving average and ADX filter options which makes it possible to filter out only the strongest setups. The default settings are
FREE
I  recommend you to read the   product's blog  (manual) from start to end so that it is clear from the beginning what the indicator offers. This multi time frame and multi symbol indicator scans for Pin bars, Morning/evening stars, Engulfings, Tweezers, Three Line Strikes, Inside bars and Pennants and Triangles.  The indicator can also be used in single chart mode. Please read more about this option in the product's   blog . Combined with your own rules and techniques, this indicator will allow
I recommend you to read the   product's blog  (manual) from start to end so that it is clear from the beginning what the indicactor offers. This multi time frame and multi symbol indicator can identify the following 5 crosses: when a fast moving average crosses a slow moving average line. when price has reached a single moving average (closed above/below or just bounced). when a triple moving average formation has appeared (all 3 MA:s in consecutive alignment) when the MACD main line crosses th
I recommend you to read the   product's blog  (manual) from start to end so that it is clear from the beginning what the indicactor offers. This multi time frame and multi symbol indicator identifies double or triple top/bottom formations or a following neckline breakout (confirmed top/bottom). It offers filters for RSI overbought/oversold, candle patterns (pin bar, engulfing, tweezer, morning/evening star, three line strike) and divergences (MACD, OsMA, Awesome (AO), RSI, CCI, Stochastic) whic
I recommend you to read the   product's blog  (manual) from start to end so that it is clear from the beginning what the indicactor offers. This multi time frame and multi symbol indicator identifies double or triple top/bottom formations or a following neckline breakout (confirmed top/bottom). It offers RSI, pin bar, engulfing, tweezer, morning/evening star filters as well divergence filter options which makes it possible to filter out only the strongest setups. The indicator can also be used
This indicator can send alerts when a Heiken Ashi Smoothed color change occurs. Combined with your own rules and techniques, this indicator will allow you to create (or enhance) your own powerful system. Features Can send all types of alerts. Option to delay the alert one or more bars in order to confirm the color (trend) change. Input parameters Candle shift for alert: Default is 1. Setting it to 0 will alert you on color change on the current candle. This should be regarded as a pending (uncon
FREE
I recommend you to read the  product's blog  (manual) from start to end so that it is clear from the beginning what the EA offers. This Expert Advisor identifies when a divergence occurs between price and an oscillator/indicator. It identifies both regular/classical (trend reversal) and hidden (trend continuation) divergences. It has supply/demand zone, RSI, bollinger, stochastics, moving average (regular MA and Hull MA), ADX and volume filter options which makes it possible to filter out only
This multi time frame and multi symbol indicator identifies high-probability breakout patterns. It does this by identifying strong, symmetrical pennants and triangles. This pattern DOES NOT appear very often on higher time frames. But when it does, it is a very high-probability setup. The indicator also includes an Inside bars scanner. It can for example be used to detect a special type of Inside bars formation which is formed by a Master candle (MC) followed by 4 inside candles (please see the
This indicator draws supply and demand zones on the chart. Combined with your own rules and techniques, this indicator will allow you to create (or enhance) your own powerful system. Please also check out the   paid version   which offers much more. My recommendation is to look for trading opportunities where the first zone test occurs after at least 25 bars. Features The zones have 3 colors (adjustable by input). Dark color for untested zone, medium for tested zone   and light for broken zone .
FREE
The indicator identifies when a divergence occurs between price and an indicator or oscillator. It identifies bullish and bearish hidden or regular (classical) divergences. Combined with your own rules and techniques, this indicator will allow you to create (or enhance) your own powerful system. Features Can detect divergences for the following indicators/oscillators: MACD, OsMA (Moving average of Oscillator), Stochastics, RSI, CCI, RVI, Awesome (AO), ADX, ATR, OBV, MFI, Momentum and   Composit
FREE
This indicator can send alerts when a Heiken Ashi Smoothed color change occurs. Combined with your own rules and techniques, this indicator will allow you to create (or enhance) your own powerful system. Features Can send all types of alerts. Option to delay the alert one bar in order to confirm the color (trend) change. Input parameters Wait for candle close: 'true' or 'false'. Setting it to 'true' will delay the alert to the opening of the bar following the bar where the color change occurred.
FREE
This indicator recognizes a special type of Inside Bar formation which is formed by a big Master candle followed by 4 smaller candles (please see the strategy explanation below). Features Plots buy/sell stop lines on the chart as well as well as take profit and stop loss levels. The TP/SL levels are based on the Average True Range (ATR) indicator. Object colors are changeable. Sends you a real-time alert when a Master candle formation is identified - sound / popup / email / push notification. On
This multi time frame and multi symbol indicator scans for pin bars. Combined with your own rules and techniques, this indicator will allow you to create (or enhance) your own powerful system. Features Can monitor all symbols visible in your Market Watch window at the same time. Apply the indicator to just one chart and instantly monitor the entire market. Can monitors every time frame, from M1 to MN, and sends you a real-time alert when a pin bar is identified. All Metatrader native alert types
I recommend you to read the product's blog  (manual) from start to end so that it is clear from the beginning what the EA offers. This Expert advisor's (EA) main strategy is to place trades when 3 moving averages (MA) are in consecutive alignment and at a certain distance from each other (it can be used for instance for a not very well known strategy used by some institutional traders, which involves the MAs 10, 20 and 30 on the D1 time frame). The EA works best on H1 and larger time frames. Th
Features This is an indicator that recognizes a special type of Inside Bar formation which is formed by a Master candle followed by 4 smaller candles (please see the strategy explanation below). Plots buy/sell stop lines on the chart as well as well as take profit and stop loss levels. The TP/SL levels are based on the Average True Range (ATR) indicator. Object colors are changeable. Sends you a real-time alert when a Master candle formation is identified - sound / pop-up / email / push notifica
Please if possible consider buying the MT5 version   which at the moment offers more functionaIity . I also recommend you to read the product's blog  (manual) from start to end so that it is clear from the beginning what the EA offers. This Expert advisor's (EA) main strategy is to place trades when 3 moving averages (MA) are in consecutive alignment and at a certain distance from each other (it can be used for instance for a not very well known strategy used by some institutional traders, whic
Among the top indicators offered here on the market in terms of value for money. I recommend you to read the   product's blog  (manual) from start to end so that it is clear from the beginning what the indicator offers. This supply and demand zone indicator draws the zones on the chart and sends alerts when the price has reached or broken a zone. It has support  for one nested zones (zones on one other time frame than the current)  which will also be drawn on the chart and involve alerts. It i
This multi time frame and multi symbol indicator scans for Pin bars, Morning/Evening stars, Engulfings, Tweezers, Three line strikes, Inside bars and Pennants and Triangles. The indicator can also be used in single chart mode. Please read more about this option in the product's blog . Combined with your own rules and techniques, this indicator will allow you to create (or enhance) your own powerful system. Features Can monitor all symbols visible in your Market Watch window at the same time. App
I recommend you to read the   product's blog  (manual) from start to end so that it is clear from the beginning what the indicactor offers. This multi time frame and multi symbol divergence dashboard indicator sends an alert when one or two different divergences have been identified. It can be used with all time frames from M1 to MN. Maximum 9 time frames can be shown in the dashboard at the same time. It is possible to enable moving average, RSI or Bollinger bands trend filter to filter out on
I recommend you to read the   product's blog  (manual) from start to end so that   it is clear from the beginning what the indicator offers. This multi time frame and multi symbol indicator identifies double top/bottom, head & shoulder, pennant/triangle and flag patterns. It is also possible to setup alerts only when a neckline/triangle/flagpole breakout has occured (neckline breakout = confirmed signal for top/bottoms and head & shoulders). The indicator can also be used in single chart mode.
This multi time frame and multi symbol indicator identifies when the stochastics signal line (D) crosses the stochastics main line (K) as well as options  to scan for main line and signal line level crossovers.  As a bonus it can also scan for Bollinger bands and RSI overbought/oversold crosses. Combined with your own rules and techniques, this indicator will allow you to create (or enhance) your own powerful system. Features Can monitor all symbols visible in your Market Watch window at the sam
Averaging down EA
Jan Flodin
5 (1)
This cost averaging Expert advisor (EA) places additional trades in the same direction as the original (manually opened) order when the price goes against you. It can be used as a grid system or as pure martingale system (exponential increasing of lot size) or smoothed martingale (for instance linear increasing of the lot size). Due to the risk involved, this EA is more suitable for intermediate to advanced traders who are well aware of how to handle risk management and trading an already profit
This multi time frame and multi symbol indicator identifies fractals patterns. As a bonus it can also scan for Parabolic SAR (pSAR) trend changes. Combined with your own rules and techniques, this indicator will allow you to create (or enhance) your own powerful system. Features Can monitor all symbols visible in your Market Watch window at the same time. Apply the indicator to just one chart and instantly monitor the entire market. Can monitor every time frame, from M1 to MN, and sends you a re
I recommend you to read the   product's blog  (manual) from start to end so that it is clear from the beginning what the indicactor offers. This multi time frame and multi symbol indicator scans for pin bars. Combined with your own rules and techniques, this indicator will allow you to create (or enhance) your own powerful system. Features Can monitor all symbols visible in your Market Watch window at the same time. Apply the indicator to just one chart and instantly monitor the entire market.
I  recommend you to read the   product's blog  (manual) from start to end so that it is clear from the beginning what the indicator offers. This multi time frame and multi symbol indicator scans for engulfing and tweezer formations. The indicator can also be used in single chart mode. Combined with your own rules and techniques, this indicator will allow you to create (or enhance) your own powerful system. Features Can monitor all symbols visible in your Market Watch window at the same time. Ap
I  recommend you to read the   product's blog  (manual) from start to end so that it is clear from the beginning what the indicator offers. This multi symbol and multi time frame indicator scans for the following candlestick patterns (please see screenshot for explanation of the patterns): Three white soldiers (reversal>continuation pattern) Three black crows (reversal>continuation pattern) Bullish and bearish Three line strike (reversal pattern) The patterns do not appear very often on higher
I recommend you to read the   product's blog  (manual) from start to end so that it is clear from the beginning what the indicactor offers. This multi time frame and multi symbol indicator can identify the following 5 crosses: when a fast moving average crosses a slow moving average line. when price has reached a single moving average (closed above/below or just bounced). when a triple moving average formation has appeared (all 3 MA:s in consecutive alignment). when the MACD main line crosses t
Filter:
david.l
494
david.l 2022.05.13 02:27 
 

User didn't leave any comment to the rating

ruei
88
ruei 2021.12.03 08:11 
 

User didn't leave any comment to the rating

Tran Cong Minh Duc
242
Tran Cong Minh Duc 2021.10.13 06:20 
 

Good signal when trader can combine with OB and OS in big TF.

kamz1419
149
kamz1419 2021.07.08 13:55 
 

Great product, does exactly what’s required and provides timely alerts and a range of oscillator indicators to choose from. Jan provides excellent support and is very quick to reply. Thanks

Resti Prima
228
Resti Prima 2021.03.25 16:15 
 

i already buy this product today and still test, so far so good, im scalping trade, entry on m1 or m5 with sett indicator on m15 and m30. my result is good (for a while) now i want to test the Free EA related with this indi. i will back and give more star after test. Jan is good person, and fast response, i like it. Thanks Jan!! :)

Makarios  Yacoubian
2911
Makarios Yacoubian 2020.07.19 15:09 
 

User didn't leave any comment to the rating

GoodMorningg
534
GoodMorningg 2019.11.01 10:46 
 

User didn't leave any comment to the rating

Pip Collector
346
Pip Collector 2019.08.15 09:48 
 

User didn't leave any comment to the rating

Wan Ping Fei
1690
Wan Ping Fei 2019.05.29 12:11 
 

User didn't leave any comment to the rating

sunnychow
9051
sunnychow 2018.12.16 12:56 
 

User didn't leave any comment to the rating

Lev Vladimirovic Marushkin
1696
Lev Vladimirovic Marushkin 2018.10.13 13:33 
 

User didn't leave any comment to the rating

Matthew Todorovski
12938
Matthew Todorovski 2018.06.30 14:07 
 

User didn't leave any comment to the rating

Tim Eubanks
5762
Tim Eubanks 2018.03.15 16:29 
 

User didn't leave any comment to the rating

4example
245
4example 2018.02.23 23:50 
 

User didn't leave any comment to the rating

rafaelmercadop
160
rafaelmercadop 2018.01.18 11:41 
 

User didn't leave any comment to the rating

Pealres Lukinskas
216
Pealres Lukinskas 2018.01.03 19:39 
 

User didn't leave any comment to the rating

mugenokane00
49
mugenokane00 2018.01.01 14:11 
 

User didn't leave any comment to the rating

gutentag
64
gutentag 2017.08.22 09:16 
 

User didn't leave any comment to the rating

[Deleted] 2017.07.31 09:49 
 

User didn't leave any comment to the rating

wckco
16
wckco 2017.07.30 12:17 
 

User didn't leave any comment to the rating

Reply to review
Version 3.3 2022.06.15
*** Please always make a backup of the existing indicator (the .ex4 file) before you make an update ***

- added the possibility to set the price type for RSI, CCI, RVI, ADX, OBV and Momentum divergences
Version 3.2 2022.01.20
*** Please always make a backup of the existing indicator (the .ex4 file) before you make an update ***

- added the possibility to be alerted only if the following candle (the candle after the divergence candle) is an engulfing candle. More information in the product's blog.
Version 3.1 2022.01.17
*** Please always make a backup of the existing indicator (the .ex4 file) before you make an update ***

- added an option to ignore wicks on divergence candles, hence divergence signals will based on open/close prices instead of high/low prices.
Version 3.0 2021.12.03
*** Please always make a backup of the existing indicator (the .ex4 file) before you make an update ***
This is not a mandatory update.

- added an option to hide the divergence lines in the chart window
Version 2.9 2021.11.19
*** Please always make a backup of the existing indicator (the .ex4 file) before you make an update ***

- added Accumulation/Distribution and Accelerator divergences
- added an option to set the minimum amount of bars between extremums
- added an option to use an ATR filter instead of the RSI filter
- changed the parameter structure for the Stochastics oversold/overbought filter for Stochastics divergences
Version 2.8 2021.11.04
*** Please always make a backup of the existing indicator (the .ex4 file) before you make the update ***

- added a possibility to enable a stochastics overbought/oversold filter for stochastics divergences
Version 2.7 2021.08.27
*** Please always make a backup of the existing indicator (the .ex4 file) before you make the update ***

- added options to wait for a Donchian channel breakout or Moving average cross to confirm the divergence before signaling the trade
Version 2.6 2020.07.17
*** Please always make a backup of the existing indicator (the .ex4 file) before you make an update ***

- I have changed the logic of detecting divergences so that more divergences will be detected. The new logic will allow divergences even if there are additional indicator extremums (top/bottoms) between the 2 already existing extremum points. Please be aware of the fact that the new logic also comes with a performance cost. Something which will be more visible on slower computers.
Version 2.5 2020.05.29
- bug fix in the strict mode logic
- added an option to disable drawing of lines and arrows if the RSI filter is enabled and the price it outside the RSI levels
Version 2.4 2020.02.15
- added an option to embed a custom alert text into the alert
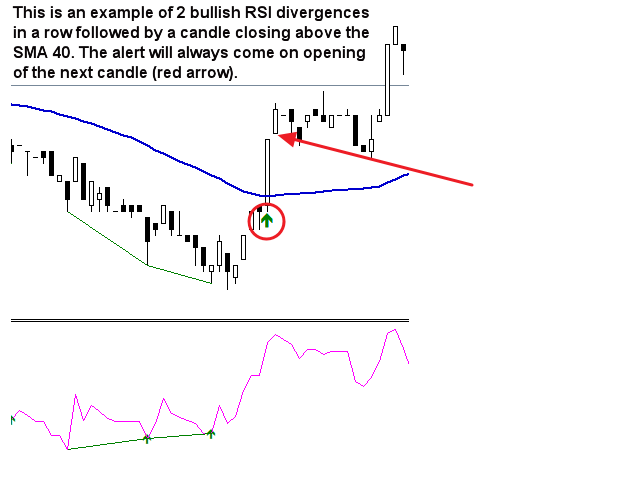
- upon request I have added the possibility to scan for "early" divergences. This means that the alert will come directly upon candle open instead of waiting for the slope in the indicator to change direction (candle shift 1 or 2). Candle shift must be set to 0 for this to work. Please be aware though that this will lead to more false signals (repaintings)
Version 2.3 2019.11.10
- fixed an issue with saving the color settings for the indicator level lines
- Replaced the parameter 'Wait for candle close' with new parameter 'Divergence candle shift'. Value 1 = previous parameter set to False and value 2 was value True. You can also set a higher value than 2.
Version 2.2 2019.10.31
- added support for MACD signal line, MFI and Momentum divergences
- added the possibility to show MACD main line as histogram instead of a line (same as in the Metatrader native MACD indicator)
Version 2.1 2019.10.14
- fixed a problem which sometimes occured when using the indicator in the Strategy tester
Version 2.0 2019.09.18
- added support for ATR and OBV divergence
Version 1.9 2019.09.06
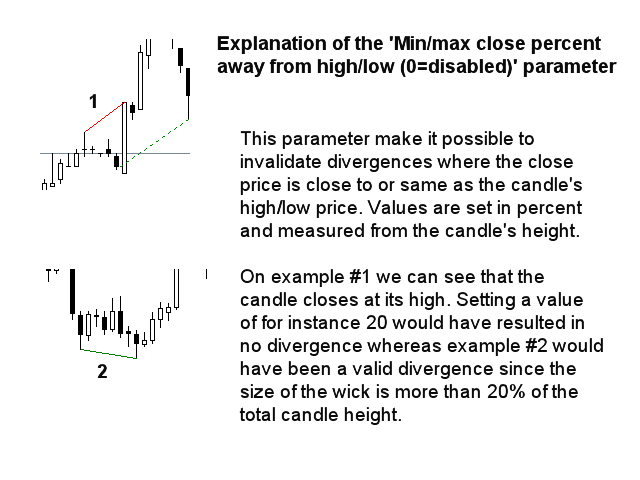
- added an option to select if divergence candle must close at least xx % away from the high/low price
Version 1.8 2019.08.27
- fixed an error in the buffer used by the iCustom() function, which can be used by an Expert Advisor
Version 1.7 2019.08.25
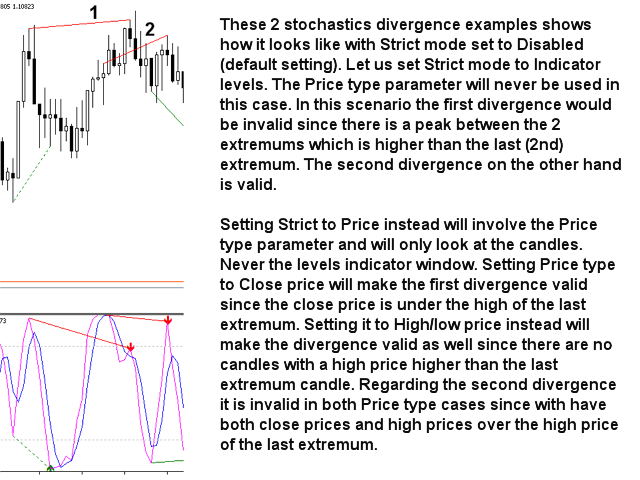
- added an option to use strict mode for price or indicator levels. When this has been enabled then the levels between the both extremums are not allowed to be higher/lower then the first or last extremum candle or indicator level. Please see the first screenshot under the product description
Version 1.6 2019.08.15
- bug fix in the custom indicator levels function
Version 1.5 2019.08.13
- corrected a bug in version 1.4
Version 1.4 2019.08.13
- add scanning for ADX and Composite Index divergences
- added a possibility to set custom line level values in the indicator window for Stochastics and RSI
- added support for iCustom() to be used with an Expert Advisor
- added apossibility to disable scanning of bullish or bearish divergences
Version 1.3 2019.02.07
- added the possibility to use RSI filter
- added the possibility to set max bars to check between extremums
Version 1.2 2018.04.18
- added possibiltity to set max history bars
- added option to scan for only hidden or regular divergences
Version 1.1 2018.01.16
- added the Awesome oscillator