Bermaui Deviation Percent
- Indicators
- Muhammad Elbermawi
- Version: 6.1
- Updated: 28 March 2020
- Activations: 20
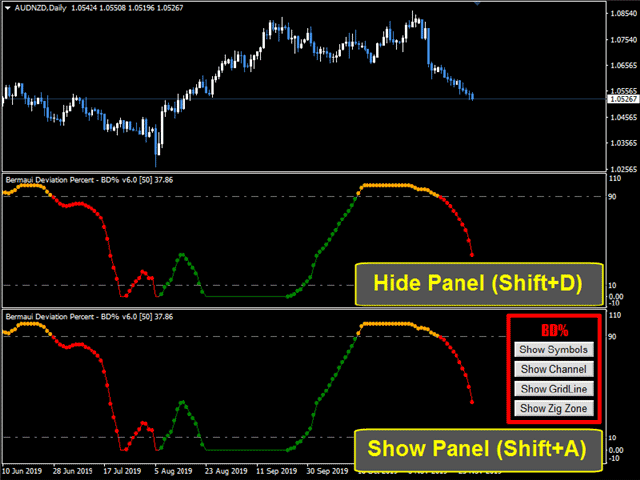
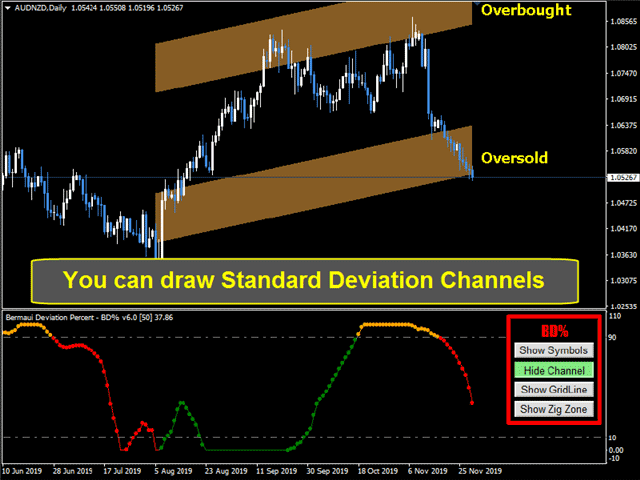
Or ( BD% ) which is a volatility index that measures volatility in percent rather than points. The idea of BD% is to make an index depending on the Classic Standard Deviation (CSD) that moves between 0 and 100 percent.
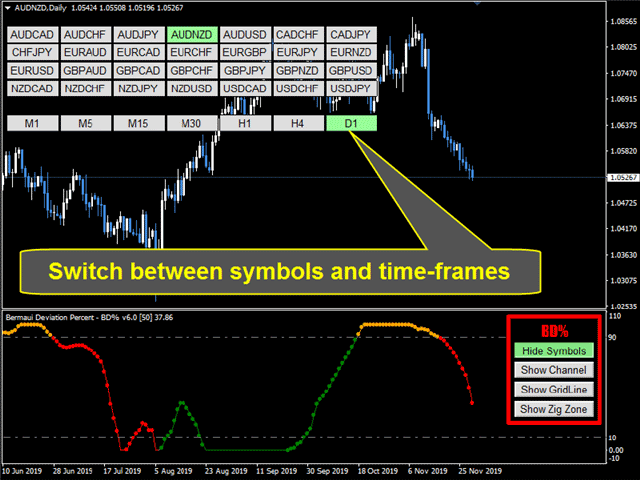
You can use BD% to compare volatility for the same security in different time periods or different time-frames. In addition, you can use BD% to compare volatility between different securities in different markets in terms of percent rather than points.
HOW TO USE "BD%"
To know more about BD% then read the user's manual from here: https://www.mql5.com/en/blogs/post/718182
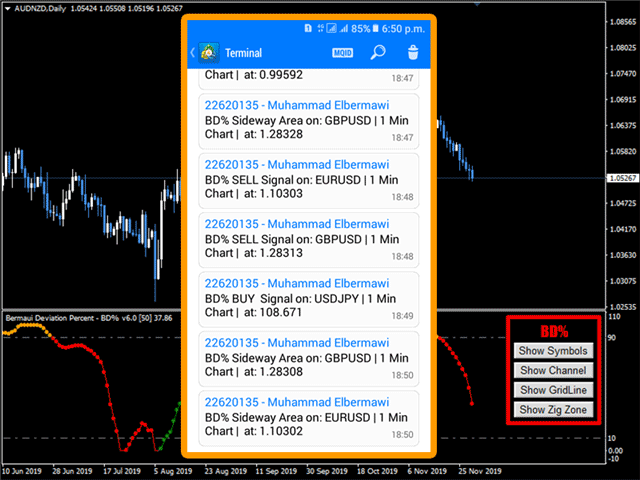
If you have any questions then please, contact me via a private message or, write them in the comment section.
Muhammad Al Bermaui, CMT
You can use BD% to compare volatility for the same security in different time periods or different time-frames. In addition, you can use BD% to compare volatility between different securities in different markets in terms of percent rather than points.
HOW TO USE "BD%"
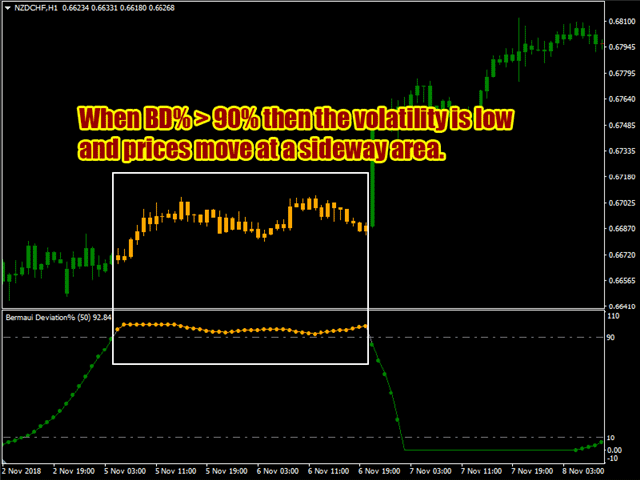
- If BD% is under 90% and then crosses this level upwards, this is a sign that prices may move in a ranging area.
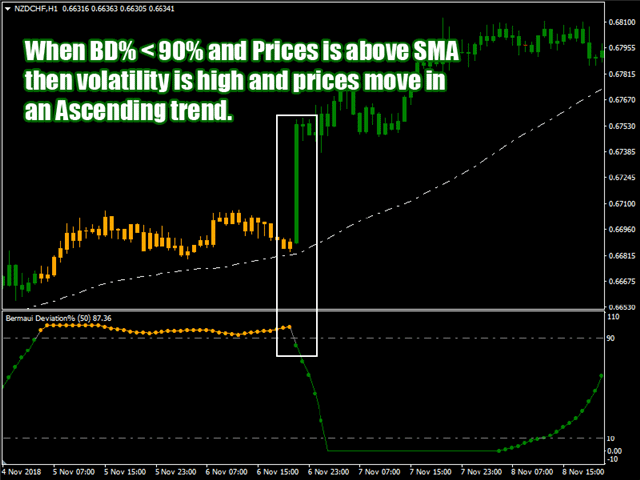
- If BD% is above 90% and then crosses this level downwards, and the price is already above its simple moving average, this is a sign of the beginning of a new ascending trend. As BD% gets deeper to the downside, volatility and trend strength are increasing. When BD% is 0%, this means that volatility is at its highest value.
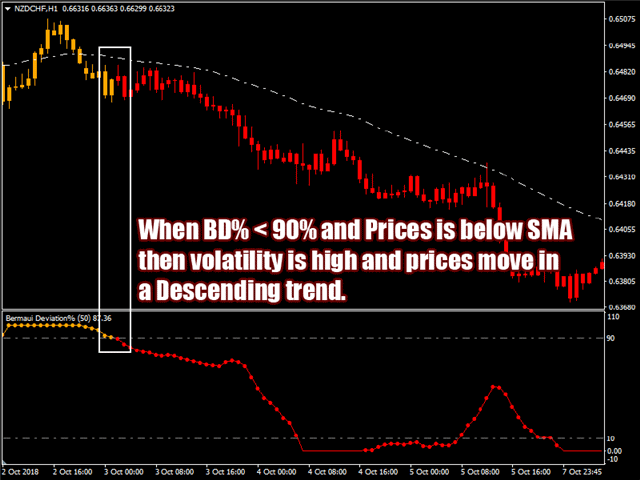
- If BD% is above 90% and then crosses this level downwards, and the price is already below its simple moving average, this is a sign of the beginning of a new descending trend. As BD% gets deeper to the downside, volatility and trend strength are increasing. When BD% is 0%, this means that volatility is at its highest value.
To know more about BD% then read the user's manual from here: https://www.mql5.com/en/blogs/post/718182
If you have any questions then please, contact me via a private message or, write them in the comment section.
Muhammad Al Bermaui, CMT


It works really great. Now I can find the trade which is really trending! The sellers produckt is really good quality. Try also his TDO you will not regret it!