Tick Vision
- Indicators
- Dmitry Homenkov
- Version: 1.0
- Activations: 10
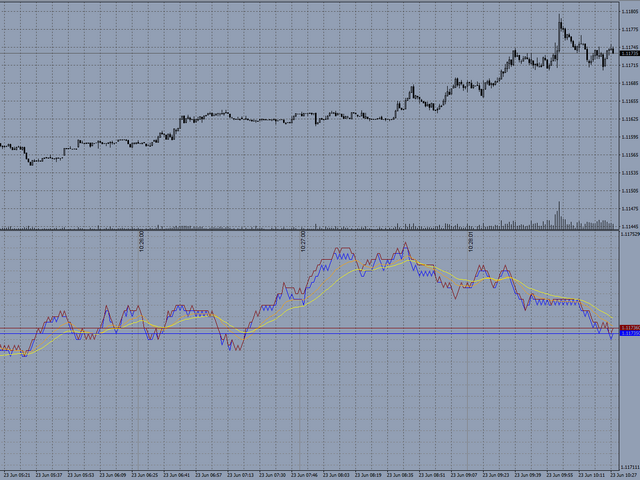
The Tick Vision indicator is a convenient tool for manual scalping. The indicator plots a tick chart in real time in a separate window. It is also possible to plot 2 additional ЕМА's of the price. Period for the ЕМА is the number of ticks. The indicator does not overload the system. You set the number of ticks to be displayed by the indicator. For even greater visual control, a grid with adjustable step is set, similar to the main chart. There are also period separators (1 minute) to control the arrival time of the ticks.
Key Features
- Tick chart in real time
- Overlay of the tick chart with 2 ЕМА's, where the period is the number of ticks
- Does not overload the system
- Overlay of the chart with price grid
- Visual period separators by minutes
- Graphical settings of all parameters
Indicator Input Parameters
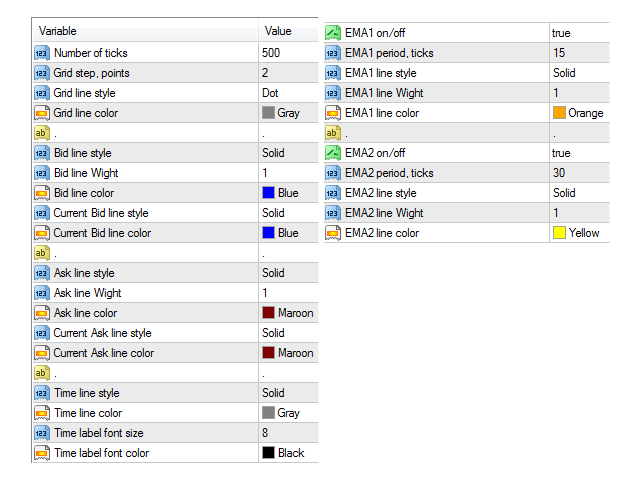
- Number of ticks - the number of ticks to be displayed on the chart. The last ticks are replaced by new ones within the specified number
- Grid step - the distance between the grid lines in points
- Grid line style
- Grid line color
- Bid line style
- Bid line wight
- Bid line color
- Current Bid line style
- Current Bid line color
- Ask line style
- Ask line wight
- Ask line color
- Current Ask line style
- Current Ask line color
- Time line style
- Time line color
- Time label font size - font for marking the 1-minute period on the grid
- Time label font color
- EMA1 on/off - true/false
- EMA1 period - period for the EMA is defined by the number of ticks
- EMA1 line style
- EMA1 line wight
- EMA1 line color
- EMA2 on/off - true/false
- EMA2 period - period for the EMA is defined by the number of ticks
- EMA2 line style
- EMA2 line wight
- EMA2 line color
