Three line candle scanner with RSI filter
- Indicators
- Jan Flodin
- Version: 1.5
- Updated: 11 February 2024
- Activations: 10
I recommend you to read the product's blog (manual) from start to end so that it is clear from the beginning what the indicator offers.
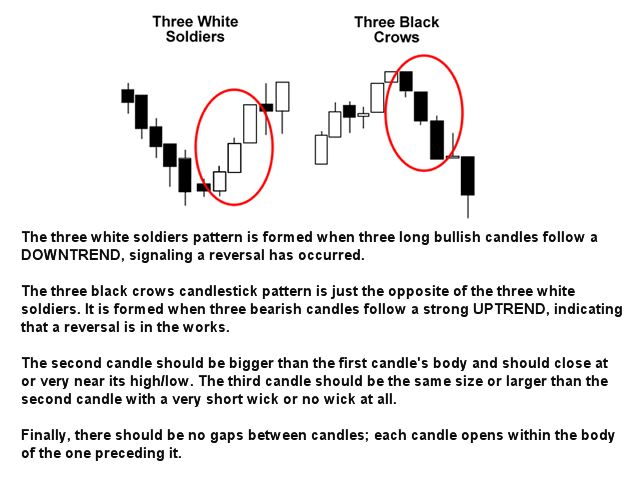
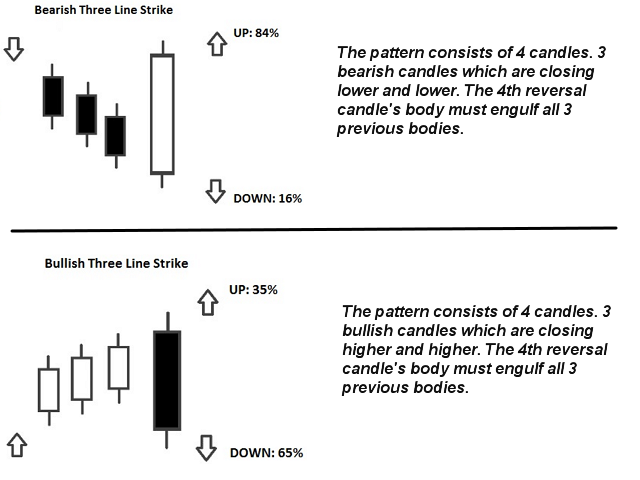
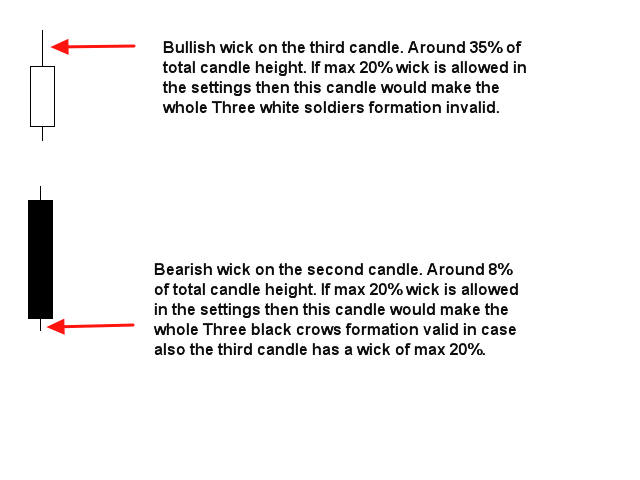
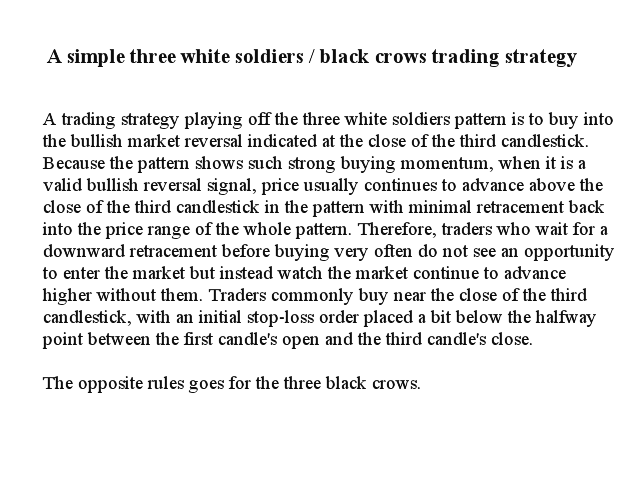
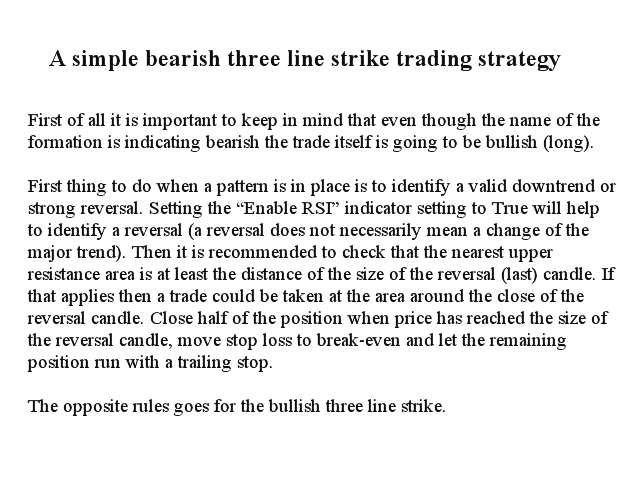
This multi symbol and multi time frame indicator scans for the following candlestick patterns (please see screenshot for explanation of the patterns):
- Three white soldiers (reversal>continuation pattern)
- Three black crows (reversal>continuation pattern)
- Bullish and bearish Three line strike (reversal pattern)
The patterns do not appear very often on higher timeframes when the strict option in the indicator settings is enabled. But when they do, it is a very high-probability setup. According to Thomas Bulkowski (internationally known author and a leading expert on candlestick patterns), the Three line strike has the highest overall performance rank of any candlestick pattern. Combined with your own rules and techniques, this indicator will allow you to create (or enhance) your own powerful system.
Features
- Can monitor all symbols visible in your Market Watch window at the same time. Apply the indicator to just one chart and instantly monitor the entire market.
- Can monitor every time frame, from M1 to MN, and sends you a real-time alert when a pattern is identified. All Metatrader native alert types are supported.
- The indicator can also be used in single chart mode.
- Can use RSI or Bollinger bands as a trend filter in order to properly identify potential reversals.
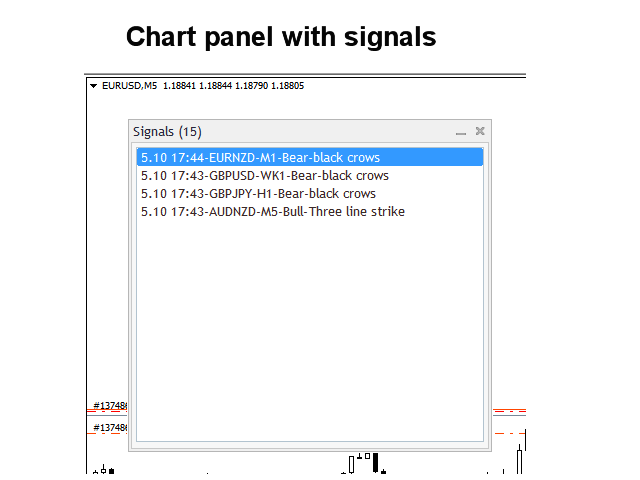
- The indicator includes an interactive panel. When clicking on an item a new chart will be opened with the symbol and time frame in question.
- The indicator can write the signals to a text file or to global variables which can be used by an Expert Advisor (EA) for auto trading. You can find more information about the content and location of the text file in the blog.
Input parameters
Please find the description and explanation of the input parameters here.
Important
Please note that due to the multi functionality neither buy/sell advice nor lines and arrows will be drawn on the chart where the indicator is installed. Rectangle and arrow will be drawn on the chart which opens up when you click on a singal in the chart panel. It is highly advisable to put the indicator on a clean (empty) chart without any other indicators or Expert Advisors on it which could interfere with the scanner.














User didn't leave any comment to the rating