PZ 123 Pattern
- Indicators
- PZ TRADING SLU
- Version: 6.0
- Updated: 16 April 2019
- Activations: 20
Unlock powerful breakout opportunities
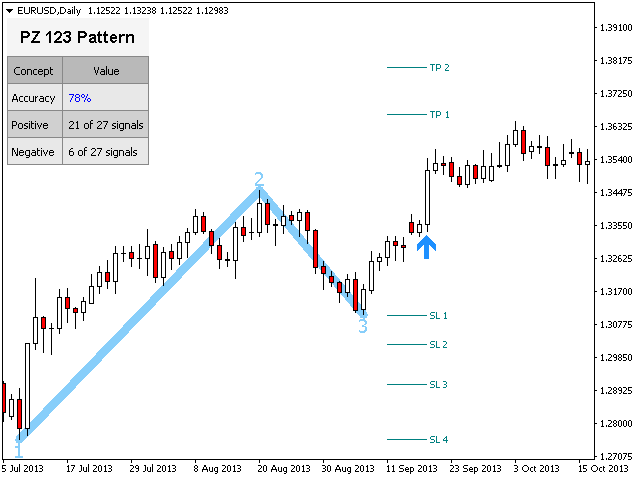
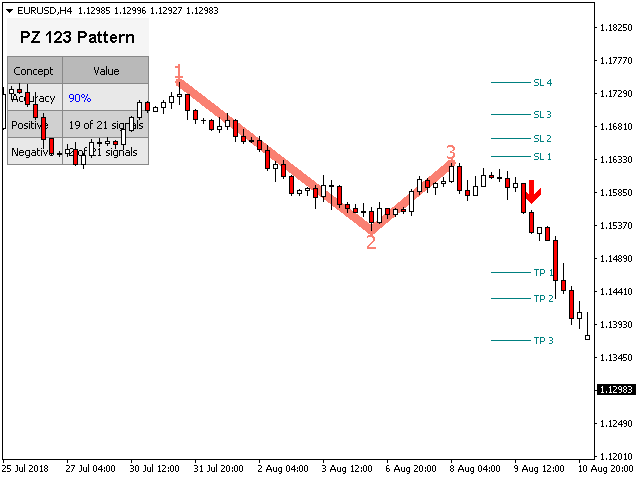
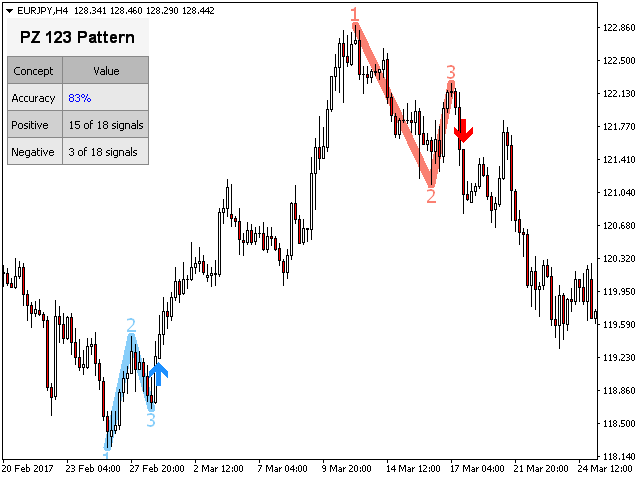
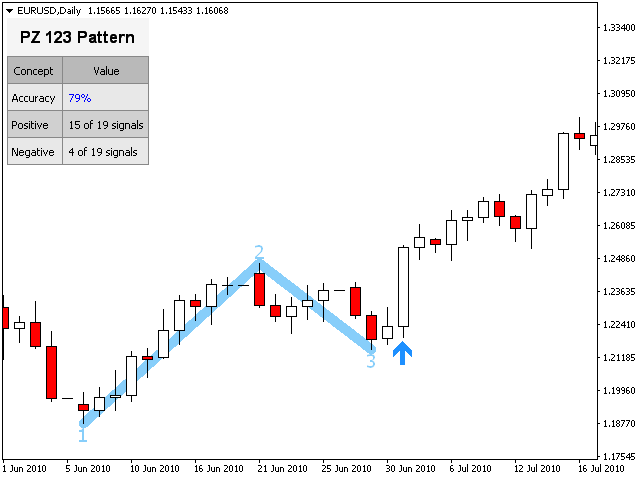
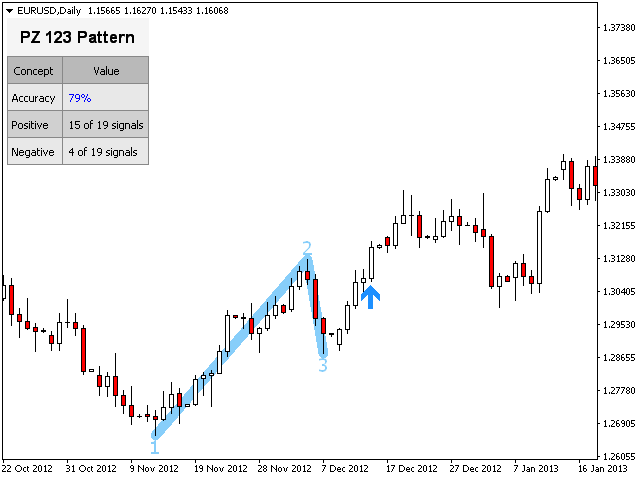
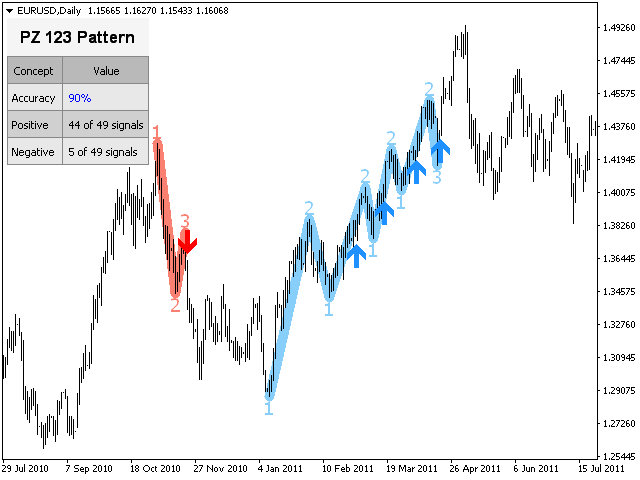
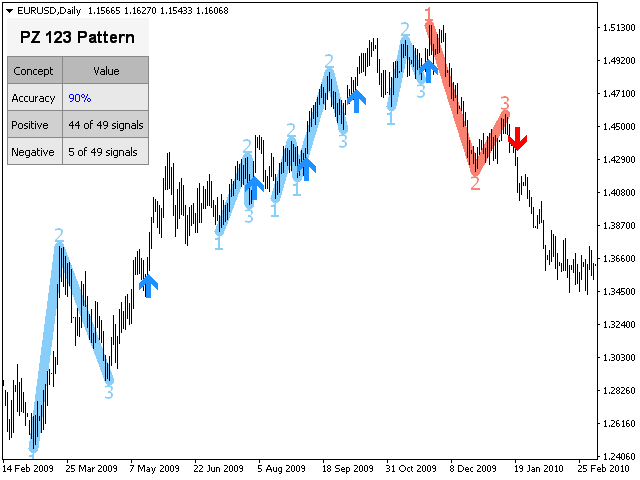
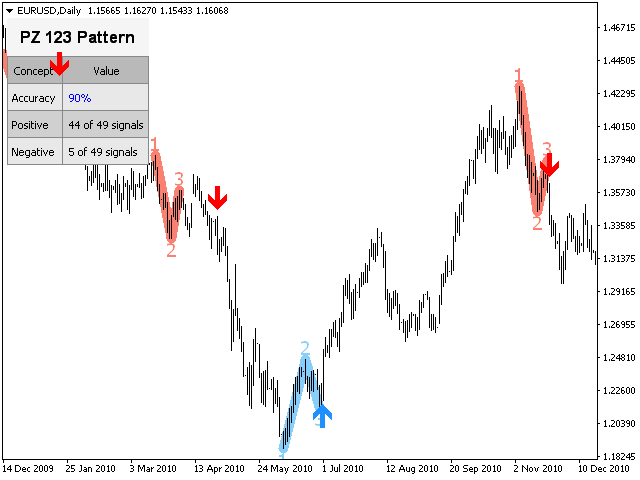
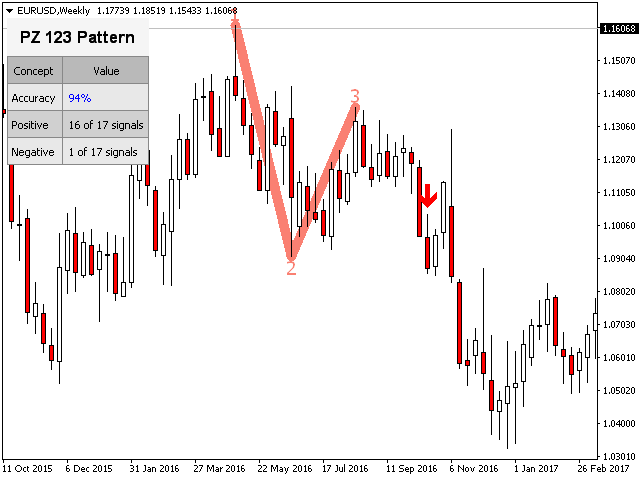
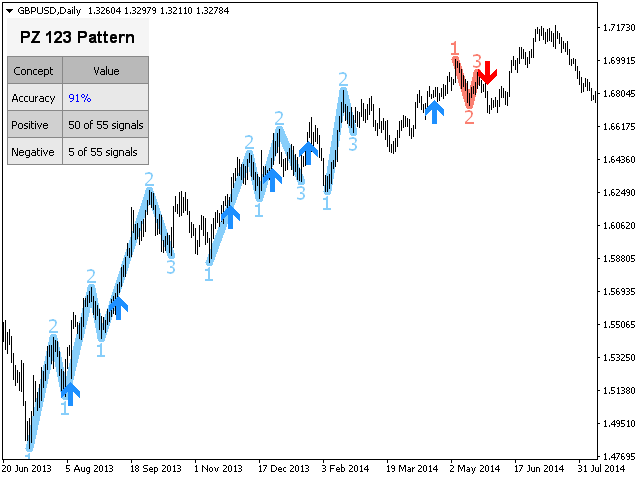
The 123 Pattern is one of the most popular, powerful and flexible chart patterns. The pattern is made up of three price points: a bottom, a peak or valley, and a Fibonacci retracement between 38.2% and 71.8%. A pattern is considered valid when the price breaks beyond the last peak or valley, moment at which the indicator plots an arrow, rises an alert, and the trade can be placed.
[ Installation Guide | Update Guide | Troubleshooting | FAQ | All Products ]
- Clear trading signals
- Customizable colors and sizes
- Implements performance statistics
- Customizable Fibonacci retracement levels
- Displays suitable stop-loss and take-profit levels
- The indicator can be used to find continuation or reversal patterns
- It is non-repainting and non-backpainting
- It implements email/sound/visual alerts
123 Patterns can present themselves as continuation or reversal patterns. To make things easier, the indicator allows you to choose which type of patterns to look for, making it a fantastic tool for trend or reversal traders.
Settings
When loading the indicator to any chart, you will be presented with a set of options as input parameters. Don't despair if you think they are too many, because parameters are grouped into self-explanatory blocks. This is what each block of parameters does.
- Amplitude - The amplitude represents the minimum amount of bars between alternative price points. To find big patterns, increase the amplitude parameter. To find smaller patterns, decrease the amplitude parameter.
- Min. Retracement - The minimum Fibonacci retracement needed in a pattern. Set to zero not to evaluate it.
- Max. Retracement - The maximum Fibonacci retracement possible in a pattern. Set to zero not to evaluate it.
- Pattern Type - The indicator can look for reversal patterns, continuation patterns or both. Your choice.
- Max History Bars - Amount of past bars to evaluate when the indicator loads in the chart.
- Display Stats - Show or hide the statistics dashboard and performance data.
- Display SL/TP Levels - Show or hide suitable SL and TP levels for each signal.
- Drawing Options - Colors and sizes for bullish or bearish lines and labels, as well as font sizes.
- Breakouts - Colors and sizes for breakout arrows.
- Alerts - Enable or disable alerts at will.
Author
Arturo López Pérez, private investor and speculator, software engineer and founder of Point Zero Trading Solutions.





User didn't leave any comment to the rating