MQLTA Currency Strength Lines
- Indicators
- MQL4 Trading Automation
- Version: 1.17
- Updated: 16 February 2021
The Currency Strength Lines (CSL) indicator is a very useful tool for both beginners and experienced traders. It is able to calculate the strength of single currencies and show them on a chart, so that you can see the trend and spot trading opportunities.
How does it work?
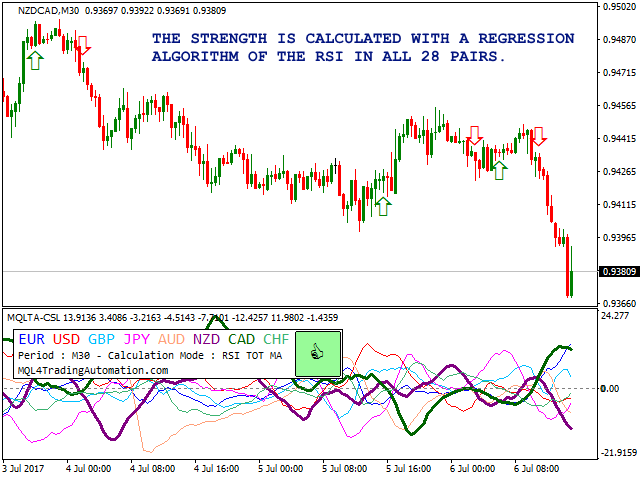
The CSL Indicator will run calculations on all the 28 pairs, resulting in the overall strength across the market of individual currencies at any given moment. You can use this data to spot currencies that are strong, getting stronger, weak, getting weaker.
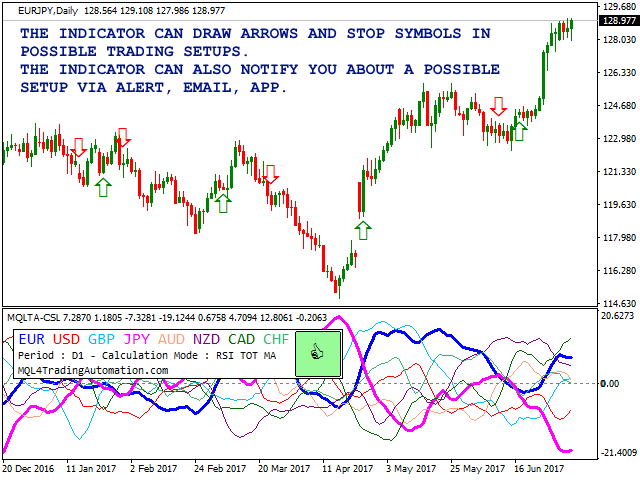
- A line going upwards means that the currency is gaining strength.
- A line pointing downwards means that the currency is becoming weak.
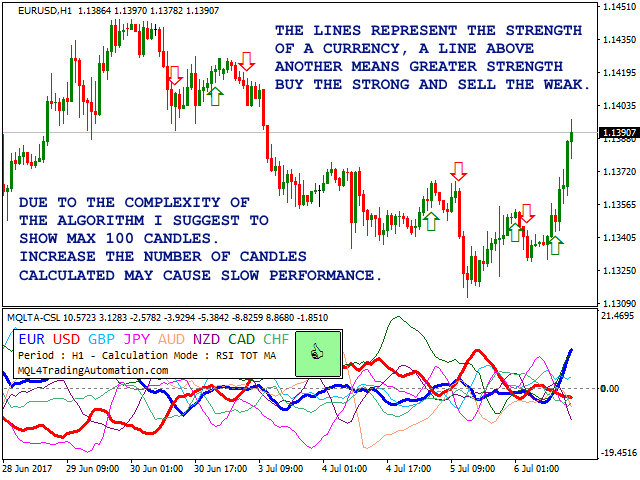
- A line above another one means that one currency is stronger than the other.
- Flat lines, or almost flat, represent currencies that are maintaining the current strength.
- A line above zero is likely to have a bullish trend against currencies below zero and vice versa.
If the option is enabled, the indicator will draw arrows for possible BUY or SELL signals on the current symbol. You can also select to be notified.
How to trade with CSL indicator
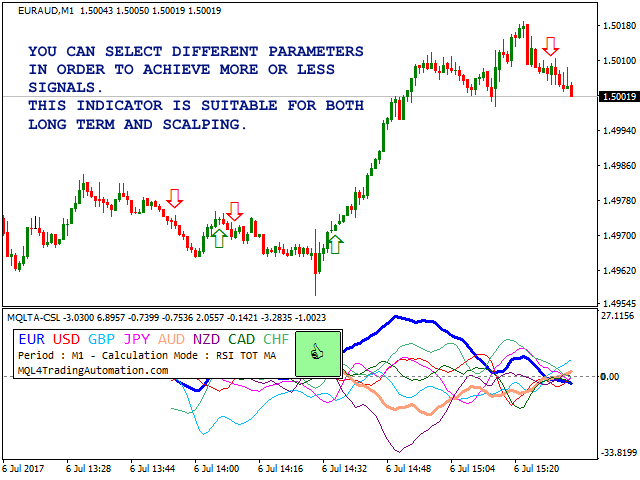
CSL Indicator can be used for long term or scalping. It is better to confirm entry signals with another indicator or price action.
- Diverging lines, that is where a currency is gaining strength and the other is losing strength.
- Better when a line above zero and one below.
- BUY the STRONG and SELL the WEAK.
Why you should use the CSL Indicator?
The Currency Strength Lines indicator is a very useful tool to:
- spot trend continuation.
- spot possible trend reversal.
- filter the pairs to trade, showing which currencies are strong and which are weak.
How to test and backtest
MetaTrader 4 has known limitations when it comes to backtest indicators and Expert Advisors involving multiple currencies, so if you are trying to try the demo or backtest the indicator follow these steps:
- Open all the 28 pairs containing the 8 major currencies and the timeframe that you want to test, allow some time to download the historical data.
- Load the indicator in the strategy tester and choose your preferred parameters.
- Select a period to test that is quite recent to make sure that the historical data for all 28 pairs are available.
To work around this process, I created a DEMO for you to to see the indicator in action with only four currencies. Check https://www.mql5.com/en/market/product/23029.
You can also rent the indicator for a month for a very low price.
Parameters
- Indicator's Name - name of the indicator. This must be different if you intend to add more than one instance.
- Calculation Mode - calculation method. Choose the more suitable one for your trading style.
- RSI Period - period of the RSI in case you select a method using the RSI (recommended between 10 and 50).
- RSI Smoothing - period of the moving average to smooth the lines when RSI MA is selected (recommended between 2 and 10).
- Show Arrow Signal - display arrows.
- Draw when a currency is above the other - display an arrow every time the lines are crossed.
- Draw if lines are opposite to the zero - less but more reliable signals.
- Buy Signal Color - buy arrow color.
- Sell Signal Color - sell arrow color.
- Neutral signal color - stop signal color.
- Enable Notification - enable/disable notifications.
- Send Alert Notification - send alert notifications (popup screen in MetaTrader).
- Alert Sound - file name of the sound to play during the alert.
- Send Notification to Mobile - send notifications to the mobile app.
- Send Notification via Email - send notifications via emails.
- Wait time between notifications - minutes of wait before sending another notification.
- Number of bars to calculate - number of bars to consider, above 1000 will cause slow loading time.
- Pairs Prefix - prefix of the pair.
- Pairs Suffix - suffix of the pair.
- Currencies to Analyze - consider/ignore the currency, recommended true
- EUR.
- USD.
- GBP.
- JPY.
- AUD.
- NZD.
- CAD.
- CHF.
- Currencies Colors and Width
- Corner to show the labels - Top or Bottom, Left or Right.
- Horizontal offset (pixels) - horizontal spacing.
- Vertical offset (pixels) - vertical spacing.
- Label Color - color of label.
- EUR - lines colors.
- USD.
- GBP.
- JPY.
- AUD.
- NZD.
- CAD.
- CHF.
- Width for Currencies not on chart - recommended 1 to 5.
- Width for Currencies on chart - recommended 1 to 5.
If you like this tool please take a minute to leave a review.
If you have suggestions to improve it please send me a message and we can discuss it further.
Feel free to visit my profile and "Add to friends" https://www.mql5.com/en/users/mql4autotrading.









I love it!