PZ Triple Top Bottom MT5
- Indicators
- PZ TRADING SLU
- Version: 4.1
- Updated: 31 January 2022
- Activations: 20
Leverage triple top and bottom patterns for better market timing
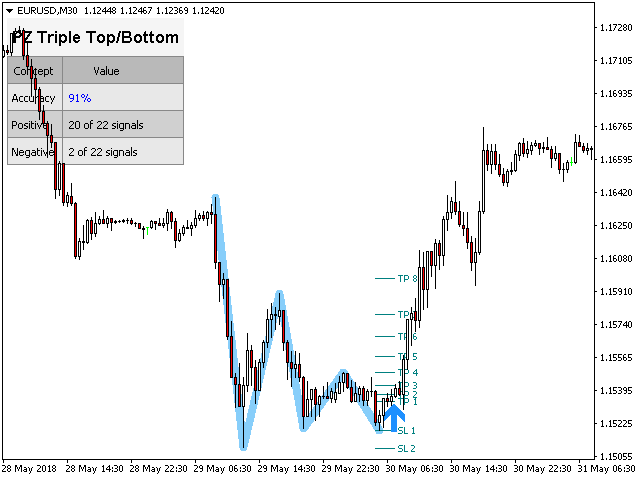
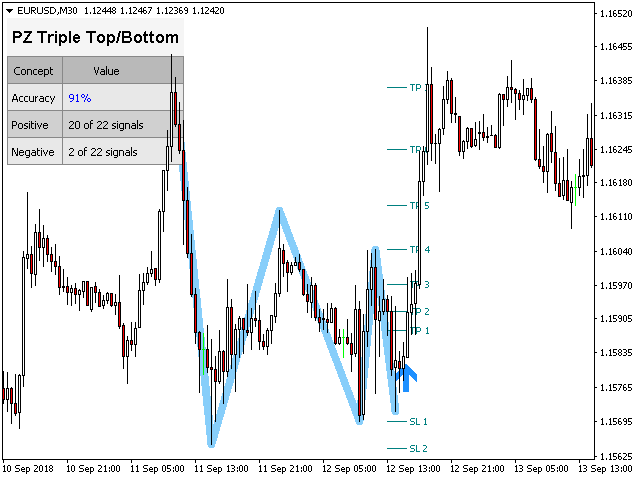
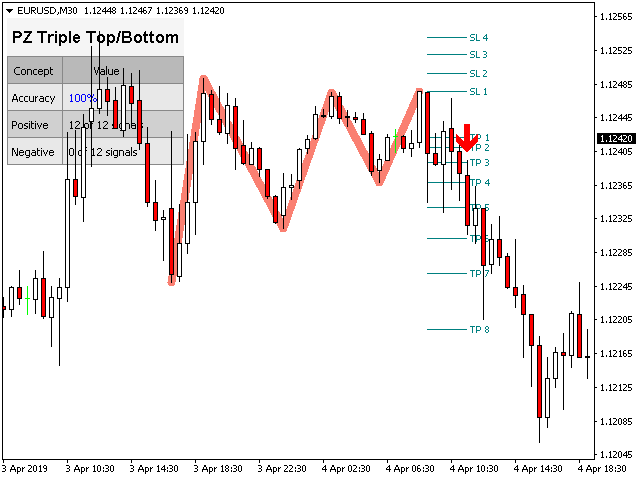
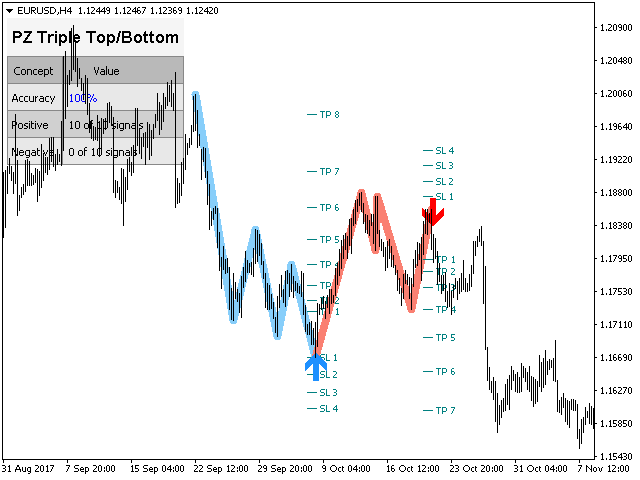
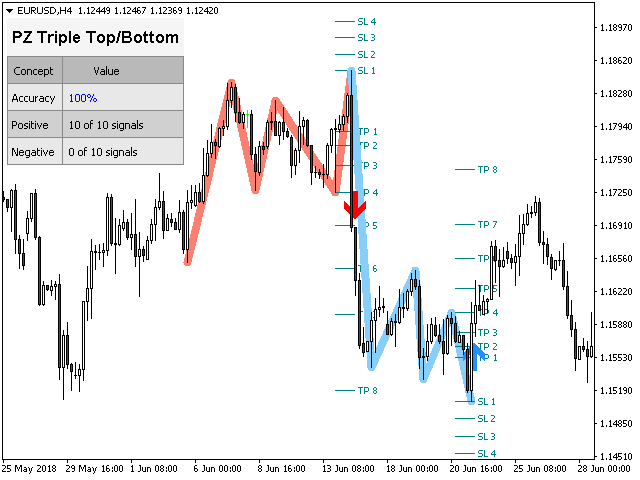
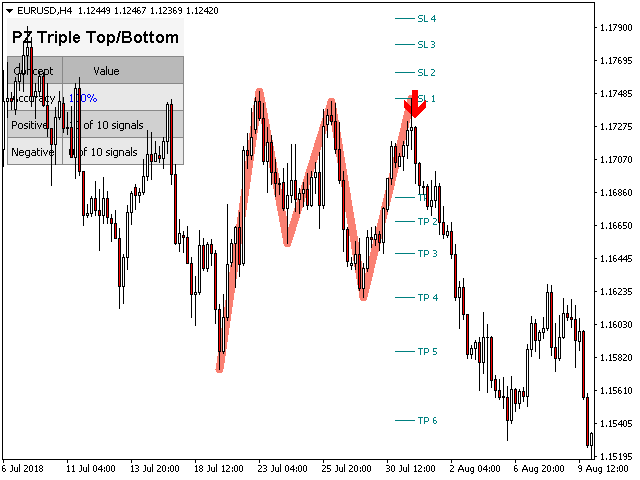
The triple top and bottom pattern is a type of chart pattern used in to predict the reversal of trend. The pattern occurs when the price creates three peaks at nearly the same price level. The bounce off the resistance near the third peak is a clear indication that buying interest is becoming exhausted, which indicates that a reversal is about to occur.
[ Installation Guide | Update Guide | Troubleshooting | FAQ | All Products ]
- Clear trading signals
- Customizable colors and sizes
- Implements performance statistics
- Customizable Fibonacci retracement levels
- Displays suitable stop-loss and take-profit levels
- The indicator can be used to find continuation or reversal patterns
- It implements email/sound/visual alerts
These patterns can expand, and the indicator follows the pattern by repainting. However, the indicator implements a twist to make it easier to trade: it waits for a Donchian breakout in the right direction before signaling the trade, making its signals very reliable and mostly non repainting.
Input Parameters
When loading the indicator to any chart, you will be presented with a set of options as input parameters. Don't despair if you think they are too many, because parameters are grouped into self-explanatory blocks. This is what each block of parameters does.
- Amplitude - The amplitude represents the minimum amount of bars between alternative price points. To find big patterns, increase the amplitude parameter. To find smaller patterns, decrease the amplitude parameter. You can load the indicator many times in the chart with different amplitudes.
- Min. Retracement - The minimum Fibonacci retracement needed in a pattern.
- Max. Retracement - The maximum Fibonacci retracement possible in a pattern.
- Top/Bottom Retracement- This parameter describes how "flat" must the top or bottom be.
- Max History Bars - Amount of past bars to evaluate when the indicator loads in the chart.
- Display Stats - Show or hide the statistics dashboard and performance data.
- Display SL/TP Levels - Show or hide suitable SL and TP levels for each signal.
- Drawing Options - Colors and sizes for bullish or bearish lines and labels, as well as font sizes.
- Breakouts - Colors and sizes for breakout arrows.
- Alerts - Enable or disable alerts at will.
Author
Arturo López Pérez, private investor and speculator, software engineer and founder of Point Zero Trading Solutions.
