Pan PrizMA C D Phase
- Indicators
- Aleksey Panfilov
- Version: 1.2
- Activations: 20
Pan PrizMA CD Phase is an analogue of the МetaТrader 5 indicator, and is an option based on the Pan PrizMA indicator. Details.
- Averaging by a quadric-quartic polynomial increases the smoothness of lines, adds momentum and rhythm.
- Extrapolation by the sinusoid function near a constant allows adjusting the delay or lead of signals.
- The value of the phase - wave status parameter (which is close in meaning to the trigonometric phase or the angle of the radius-vector rotation in the trigonometric plane) allows digitizing each line point and use any necessary point as a trading signal in the EA. This, in turn, accelerates optimization of strategies.
- Digitization allows you to set asymmetric permission/prohibition intervals during filtering. For instance, the interval prohibiting trading against a trend may comprise 90 degrees starting from any phase, only a quarter of the entire wave period.
- Using synthetic bars by volume, price or their combination allows adjusting the chart scale for the strategy.
External variables
- Line_1_power - degree of polynomial, averaging the first line (2-4).
- Fast_line_1_leverage - leverage (an analog of period) of a short average line smoothed by a polynomial.
- Fast_line_2_leverage - leverage of a short line extrapolated by the sinusoid near a constant.
- Base - half of the SMA period subtracted from the price. Analog of a Slow_SMA. The value of 0 excludes subtraction from the price.
- Synthetic_Channel - value of the synthetic bar defined as the sum of price points and the number of parts of the tick volume. The value of 0 disables synthetic bars.
- Weight_Prices - price multiplier. It allows changing the price value weight in the sum. The parameter can be negative.
- Weight_Volume - multiplier for the volume parts. It allows changing the volume value weight in the sum. The parameter can be negative.
- Multiplikator - histogram multiplier.
- Multiplikator_2 - price multiplier. -1 swaps the top and bottom lines.
- Signal SMA Period - signal line period.
Indicator lines
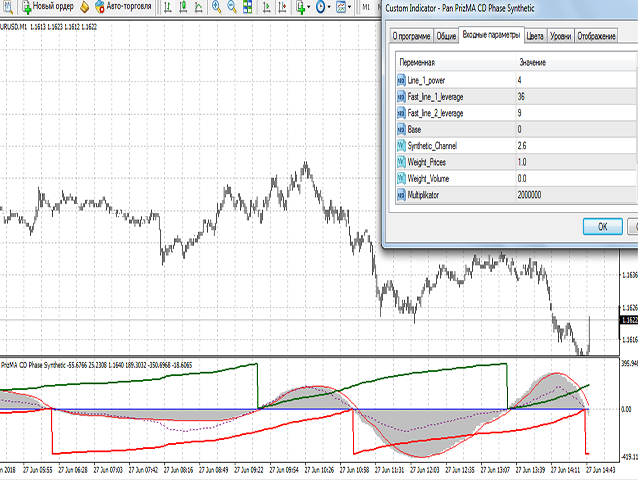
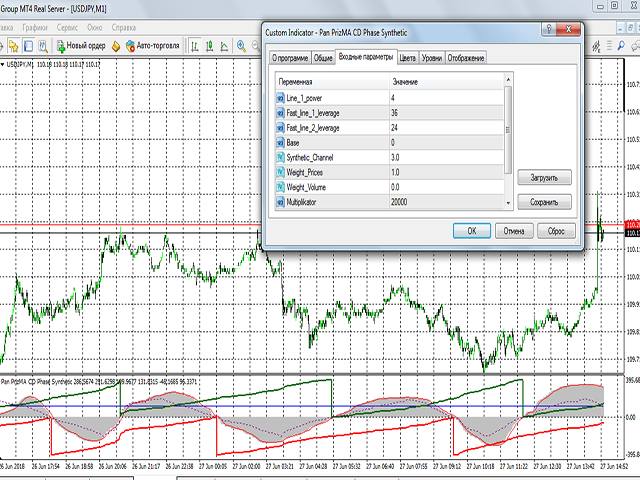
- "MACD_A0" - histogram. Plotted as the first difference on the extrapolated line. Read from the array 0.
- "Signal_A1" - histogram signal line. Read from the array 1.
- "Fast_line_1" - line averaged by the polynomial. Read from the array 2.
- "Fast_line_2" - extrapolated line. Read from the array 3.
- "Phase_A4" - phase line. Read from the array 4.
- "-_Phase_A5" - shifted phase line drawn below 0. It allows visualizing the first line on the bends. Read from the array 5.
- "+-2_Phase_A6" - dotted line provided by the MathArccos function converted from radians to degrees and multiplied by 2 to exclude coincidences with the phase lines. Read from the array 6.


User didn't leave any comment to the rating