Trend Line Index
- Indicators
- Sergey Rashevskiy
- Version: 3.0
- Updated: 27 March 2020
- Activations: 5
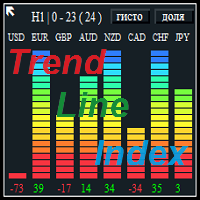
The Trend Line Index is a multi-currency indicator that shows the strength of a currency at the moment or for any period of history data.
Description of strategy and operation principle
The indicator constantly analyzes 8 currencies or the ones that make up the 28 currency pairs.
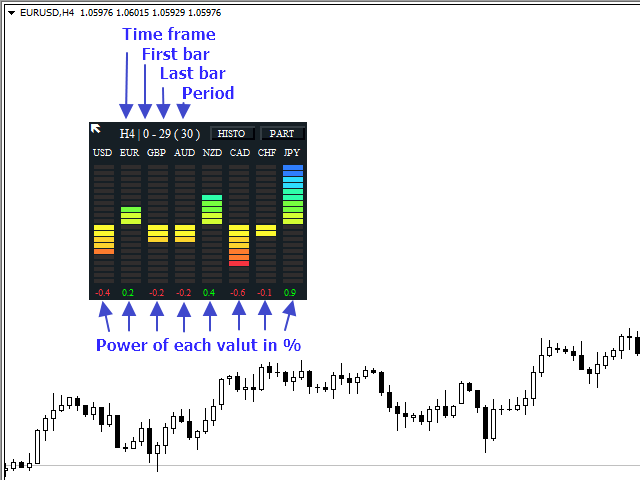
In the settings you can choose the period to analyze the movement you are interested in. To do this, select the timeframe, the number of the analyzed bars in the settings, as well as the number of the bar to start the analysis from. Thus, you can use any arbitrary period. If the initial bar for the analysis is 0, the indicator will update the data displayed on the chart in real time.
The indicator shows the average number of points passed by all currency pairs that include the specified currency. If the value is positive, then the currency has grown by an average of X points for the specified period in each pair that includes it. If the value is negative, then, respectively, the currency has lost an average of X points for the specified period. This allows to see the strength or weakness of a currency compared to other currencies. It is also possible to select indication not in points, but as a percentage of price movement.
The indicator is also able to stochastically process its data and group the currencies as rising or falling. And depending on the rise/fall value, the indicator calculates the strength percentage of the strength in the total group of strong currencies and the weakness percentage in the total group of weak currencies. In order to see the percentage in rise/fall of a specific currency pair, it is necessary to press the PART button, to switch to the initial position, press the INDEX in the indicator window.
In order to place multiple indicators on a single chart, change the Magic_Number parameter in the settings. This number is used by the indicator to distinguish its graphical objects from others.
The indicator can be placed anywhere on the screen. The initial coordinates are defined in the settings, but once the indicator is placed on the chart, you can see a diagonal arrow in its top left corner. This is the anchor. You can select it and move the indicator to any place on the screen.
It is possible to hide the histogram graph and leave only the numbers. For this purpose, there is the Show bar chart variable in the settings or the HISTO button in the indicator chart.
The indicator updates its data on every tick, as well as by timer. The update interval can be set in the Interval variable.
There are 2 options to display the currency strength chart. Defined by the Mode histo variable. by_scale - chart scaling, centered - center alignment.
Description of the indicator settings
- Work time frame - timeframe for the analysis.
- Mode calculation - calculation method of currency movement. (in points or in percents)
- Bar number - the number of bars to analyze the currency movement.
- First bar - the number of the first bar to analyze the currency movement.
- Magic number - identification number of the indicator. Designed for placing multiple instances of the indicator on the chart. For each new instance of the indicator on one chart set any number different from the others.
- Digits in percent - the number of decimal places, for calculation of currency movement as a percentage.
- Interval in mlsec - update interval of the indicator data in milliseconds.
- Symbol 1 - currency for analysis №1.
- Symbol 2 - currency for analysis №2.
- Symbol 3 - currency for analysis №3.
- Symbol 4 - currency for analysis №4.
- Symbol 5 - currency for analysis №5.
- Symbol 6 - currency for analysis №6.
- Symbol 7 - currency for analysis №7.
- Symbol 8 - currency for analysis №8.
- Prefix - if your broker uses a prefix in the names of trading instruments, enter it here. Example: if the symbol is "mEURUSD", then enter "m" into this parameter.
- Suffix - if your broker uses a suffix in the names of trading instruments, enter it here. Example: if the symbol is "EURUSDm", then enter "m" into this parameter.
- X coordinate - horizontal coordinate of the top left point of the indicator from the top left point of the chart.
- Y coordinate - vertical coordinate of the top left point of the indicator from the top left point of the chart.
- Show bar chart - show the histogram or only the numeric values of currency movements.
- Color background - background color.
- Color text - text color.
- Color positive - color of the positive value of currency movement.
- Color negative - color of the negative value of currency movement.
