AIS Correct Averages MT5
- Indicators
- Aleksej Poljakov
- Version: 3.0
- Updated: 1 July 2022
- Activations: 5
AIS Correct Averages indicator allows you to determine the beginning of the trend movement in the market. Another important quality of the indicator is a clear signal of the end of the trend. This indicator is not repainted and not recalculated.
Displayed values
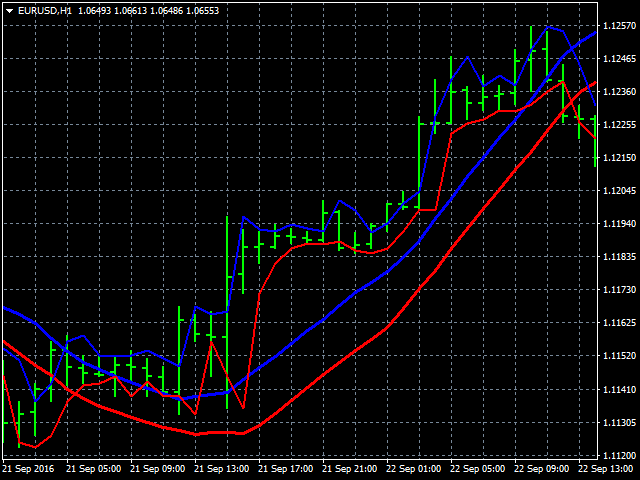
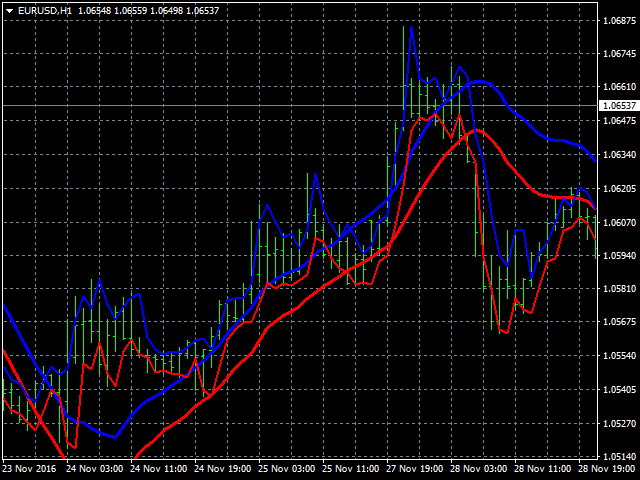
- h_AE - the upper limit of the AE channel
- l_AE - the lower boundary of the AE channel
- h_EC - High value predicted for the current bar
- l_EC - Low value predicted for the current bar
Signals for the indicator
The main channel signal is the intersection of AE and EC.
The uptrend may begin when l_EC line appears above h_AE line.
Start the downtrend may be expected after h_EC line falls below the line l_AE.
Thus it is necessary to pay attention to the width of the channel between the lines and h_AE l_AE. The greater the difference between them, the trend will be more pronounced. You should also pay attention to the achievement of local maxima / minima AE channel. At this time, the trend of price change are the strongest.
Adjustable indicator parameters
Setting the indicator is in the selection of LRH parameter depending on the timeframe. The region of valid values of this parameter - from 1 to 350.
The smaller the value, the more sensitive indicator may increase and spurious signals. On the other hand should not set this parameter too large, as the indicator will be less sensitive and will skip signals.