CumulativeDeltaBars
- Indicators
- Stanislav Korotky
- Version: 1.9
- Updated: 18 November 2021
- Activations: 5
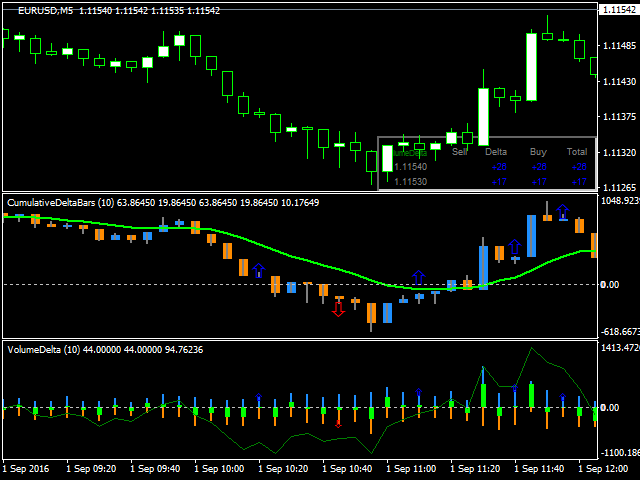
This indicator is a conventional analytical tool for tick volumes changes. It calculates tick volumes for buys and sells separately, and their delta on every bar, and displays volumes by price clusters (cells) within a specified bar (usually the latest one). The algorithm used internally is the same as in the indicator VolumeDelta, but results are shown as cumulative volume delta bars (candlesticks). Analogous indicator for MetaTrader 5 exists - VolumeDeltaBars.
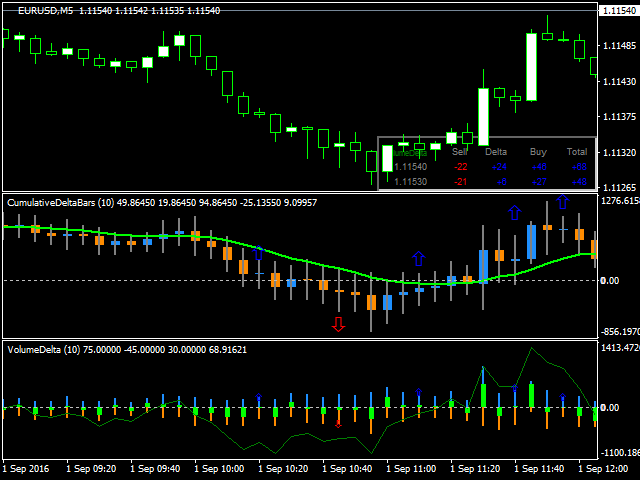
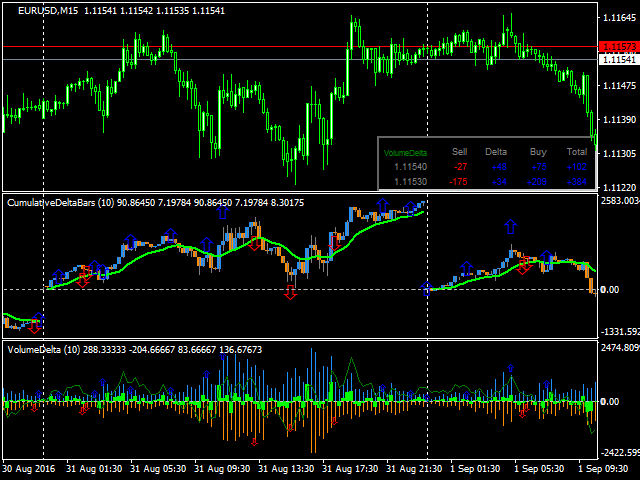
The indicator displays the following data in its sub-window:
- light-blue bars: buy (long) volumes exceed sell volumes, candle body is volume delta;
- orange bars: sell (short) volumes exceed buy volumes, candle body is volume delta;
- light-green line - cumulative delta, EMA of volume delta using (open + close)/2 values;
- blue and red arrows - mark those bars where volume direction contradicts price direction, that may be considered as a trading signal.
Also, the indicator can display a table of split volumes for the current bar in the main window. The current bar is selected by means of yellow dotted vertical line (drag it to the required position). The table rows correspond to price clusters. The table contains the following columns:
- price (a range of prices from specified value up to the next range);
- sell volume;
- delta of buy and sell volumes (positives are blue, negatives are red);
- buy volume;
- total volume (cells with values near the maximum one are highlighted in green).
Parameters
- PointsPerCell - number of points forming a single price cluster; every cluster is shown as a row in a table with splitted volumes of the current bar (this is a kind of "Time and Sales" tape); default value - 10;
- LastBars - number of bars to process; default - 1000; 0 means all bars;
- CumulativePeriod - period for calculation of cumulative delta by EMA; default - 12;
- StickToBar0 - enable/disable special mode, when the yellow dotted vertical line is always stuck to the latest bar, which effectively makes it current all the time; default - false;
- Corner - corner of the main window, where to display the table; default value - upper right corner;
- CellWidth - width of the table cells; default - 40;
- CellHeight - height of the table cells; default - 15;
- ColorBG - table background; default - black;
- FontSize - font size in the table; default - 7;
- HideTable - hide the table with splitted volumes in the main window; by default - false;
- HideMark - hide the price mark on a cluster level with maximum volume; by default - false; when both HideTable and HideMark are true, the vertical line for selection of a bar under investigation is not shown as well;
- HideAskBidInTable - disable underlining of Ask and Bid prices in the table of volume clusters; default is false, meaning that current Ask and Bid prices are highlighted in the table;
- SplitBy - selector of the splitting mode, which defines a period of resetting cumulative delta on the candlestick chart; available options are: day (by default), week, month;
- Shadow - selector of shadows modes: cumulative (by default) - standard method of showing maximum and minimum changes, discrete - specific method of showing complete splitted buy and sell volumes.
Hints
Supported timeframes: M5 and higher.
After initial placement on a chart, it may take some time for the indicator to download M1 data, and its lines may be shown as incomplete. Please wait until the indicator finishes its automatic updates.


