Trend Wave
- Indicators
- Remi Passanello
- Version: 1.41
- Updated: 17 May 2019
- Activations: 5
Trend Wave is an advanced trading tool; trend and counter trade indicator based on Supports and Resistances.
Trend Wave is designed to have an active trading at any timeTrend Wave is not lagging
Indications are given at the beginning of a new candle
Trend Wave indicates
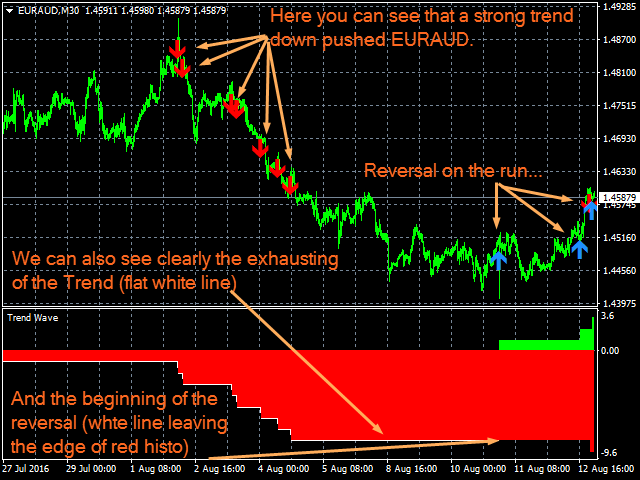
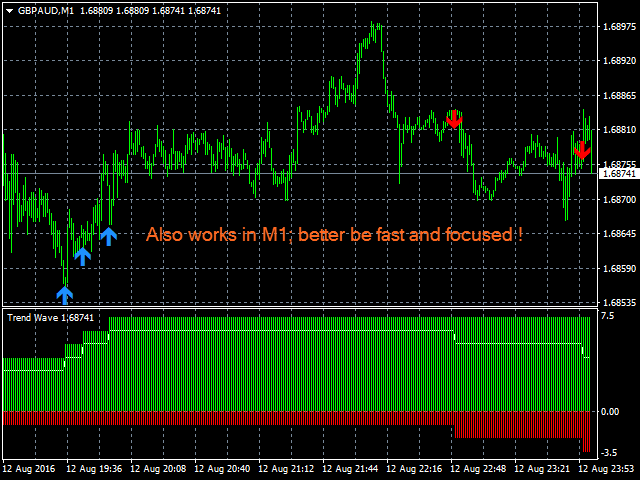
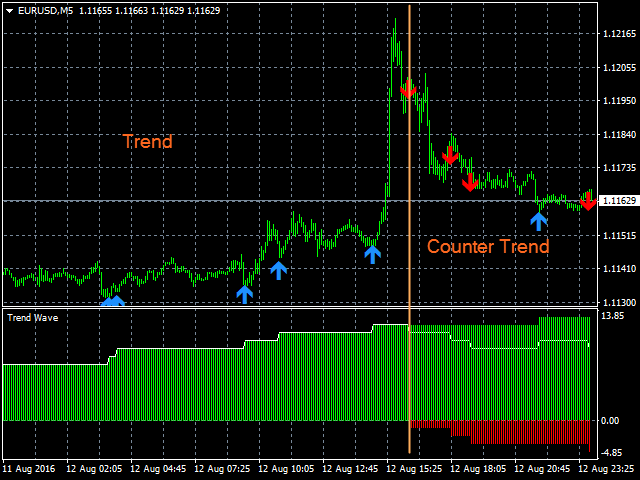
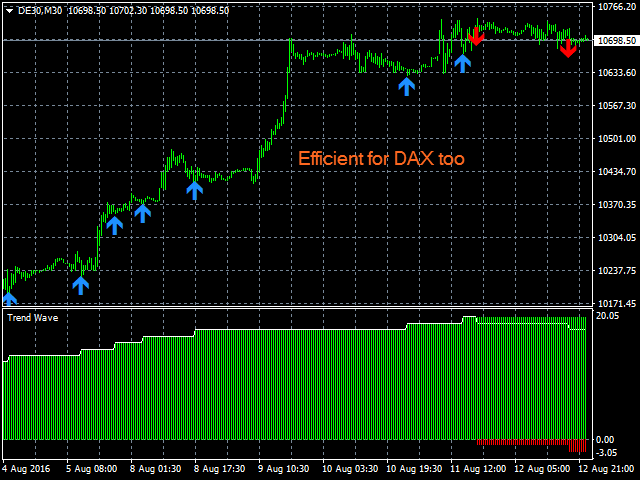
The Indicator's window shows you the actual count of S and R to get the overall trendThe white line shows the instant trend.
On the main chart window, colored arrows are displayed to show the last valid S and R. This also helps to see the trend.
Trend Wave works
At any TimeFrameWith any instrument
With any broker
Trend Wave features
Histogram representation of active R/SAverage R/S line
R/S with colored arrows
Reversal indication on the histogram
How to use Trend Wave
Very easy to set up...
Put it on your chartAdjust inputs
Follow the trend till a reversal is shown (white line is leaving the edge of the main trend)
Good to know
Don't consider colored arrows as "setting trade" indications as they show R/S. You will see that they vanishes when a support or resistance is broken so only unbroken R or S will remain; that is the concept of the "Wave".If you plan to use arrows as Trade indicators (which I don't recommend) best is to use very small lots for each trade (1% risk is far enough)
Inputs (updated for V1.4)
- Show Arrows on Chart: [bool]
- true = Shows trend arrows on chart
- false = does not show
- Trend Arrow Up:[color] Choose Arrow Up color
- Trend Arrow Down: [color] Choose Arrow Down color
- Show Histogram: [bool] Will show or hide histogram, the white line will always be visible
- true = show histogram
- false= does not show
- Auto Histogram Width: [bool] Will enable or not the histogram width according to the zoom factor of the chart
- true = Enabled
- false = Disabled, width and colors can be adjusted in the "color" tab of the indicator's proprieties window
- Show Resistance and Supports: [bool] Will show or hide R & S on the main chart
- true = Show
- false = Hide
- Show Levels: [bool] Will show or hide vertical scale levels on the main chart
- true = Show
- false = Hide
- Max History in Days: [integer] History period for Levels calculation in days
- Level Lines Color: [color] Color of the level lines on the main chart
- Show Reversals: [bool] Shows reversals on the histogram
- true = Show
- false = Hide
- Push Notifications: [bool] Enables Push Notifications
- true = Enable
- false = Disable
- Mail Notifications: [bool] Enables Mail Notifications
- true = Enable
- false = Disable
- Popup Notifications: [bool] Enables Popup window (Alert) on the main chart Notifications
- true = Enable
- false = Disable
Buffers
- TrendLine: Buffer 0 White line average value
- None: Buffer 1 Used for calculation only
- None: Buffer 2 Used for calculation only
- TrendUp: Buffer 3 Green Histogram, Support count
- TrendDn: Buffer 4 Red Histogram, Resistances count








I bought this indicator from Remi few weeks ago and after a training period where I had to become confident with it I was able to get good trade and repay the cost of the tool in few days of trading. THANK YOU REMI for this masterpiece!